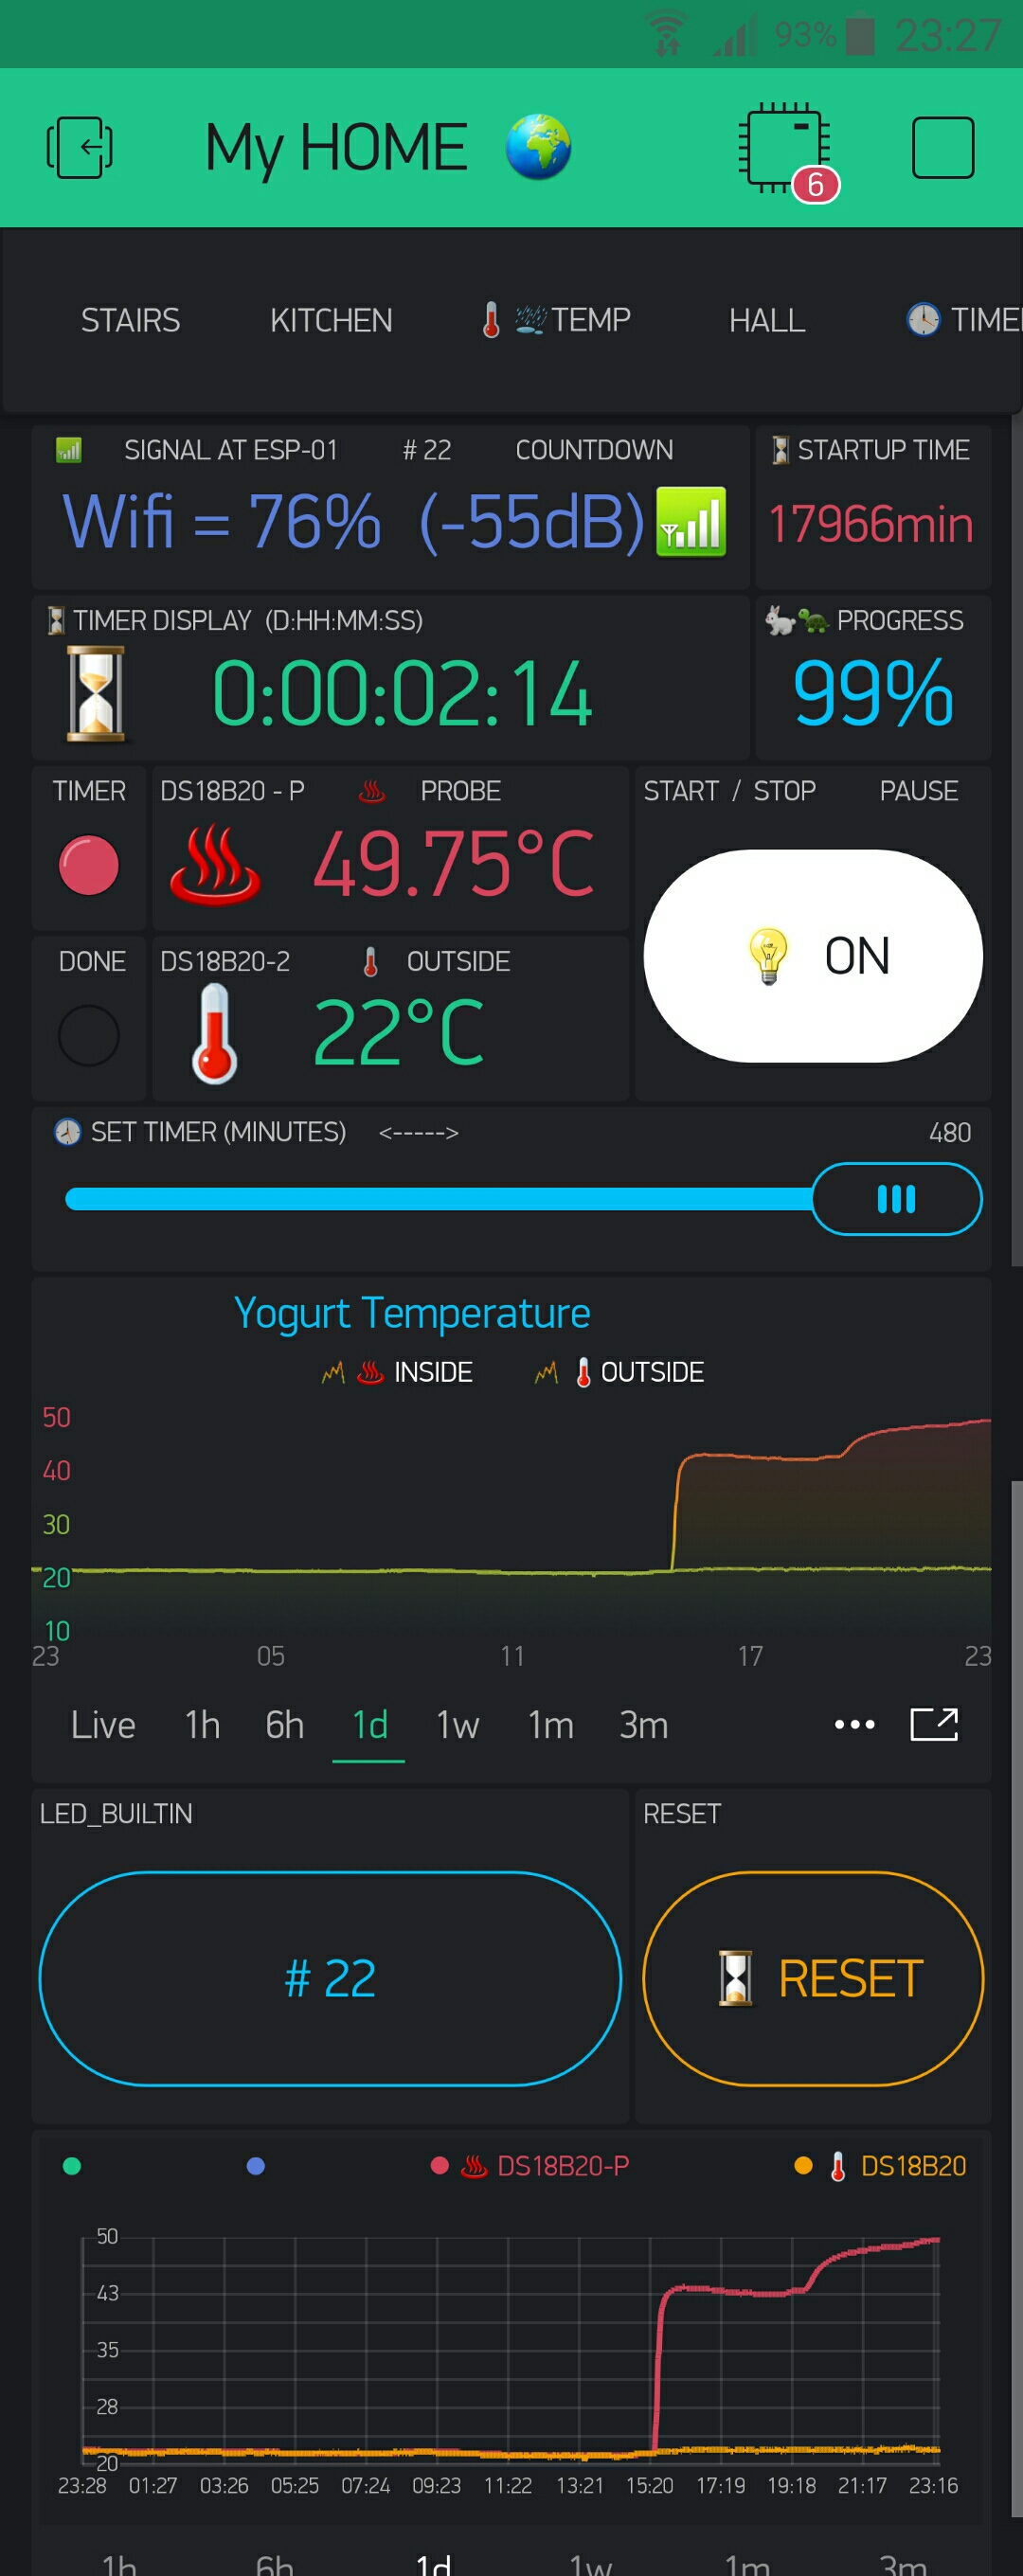
In the Blynk App, I’ve purchased a couple of these SuperCharts.
However, I believe they have a bug that causes a drag gesture to move the timeline way too fast. I’m just trying to scroll back slowly. I’ve prepared a video to demonstrate the issue on my Pixel 2:
This issue is still there, despite efforts done to remove it. It might be a blind shot, but for me it looks like some buffering issue. App tries to buffer just the same time as we are trying to scroll (?) Perhaps prebuffering some data when superchart is loaded would solve that?
It has nothing to the buffering.
Super Graph loads previous data periods on such scrolls and other gestures, and it seems, in this case, it loads them very fast, that’s why it moves to a lot of previous periods during the scroll. We are thinking about the best fix to this issue - probably we’ll add some delay so that such continuous scroll will not load previous periods fast.
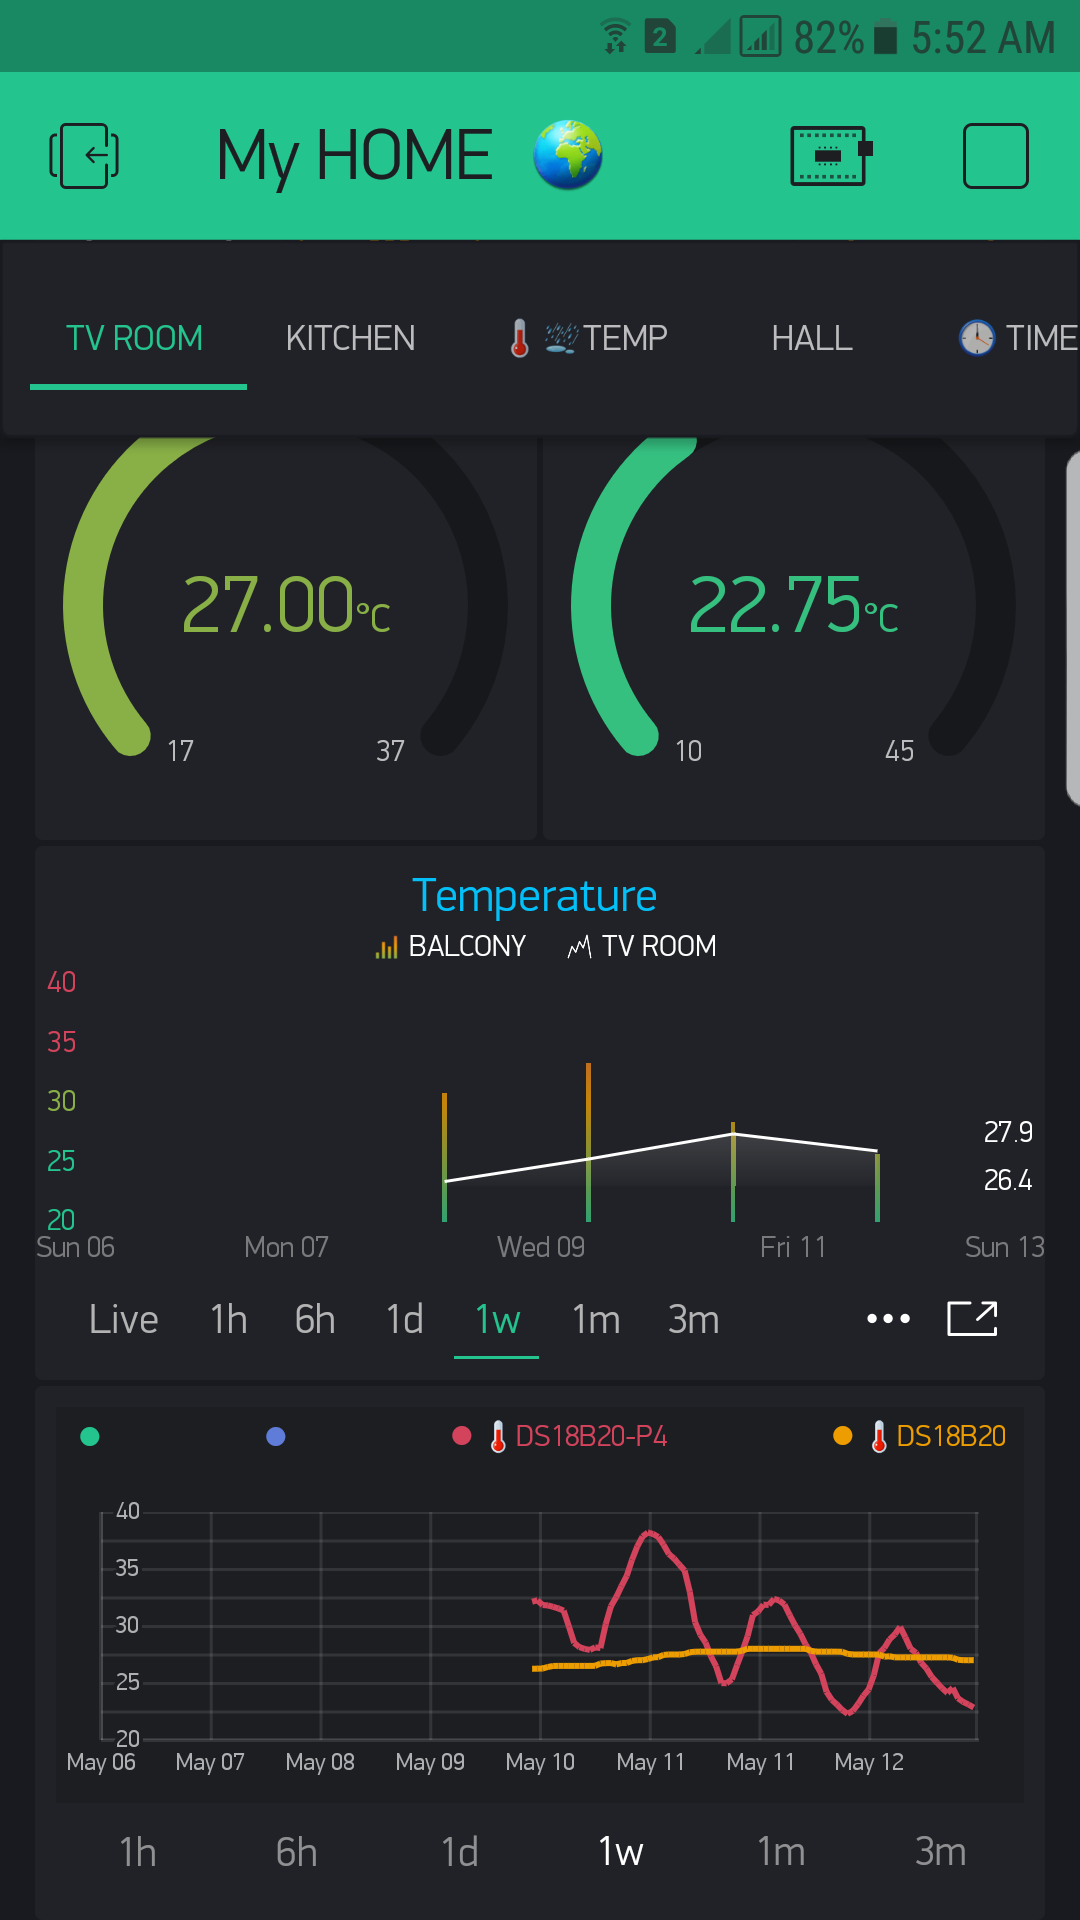
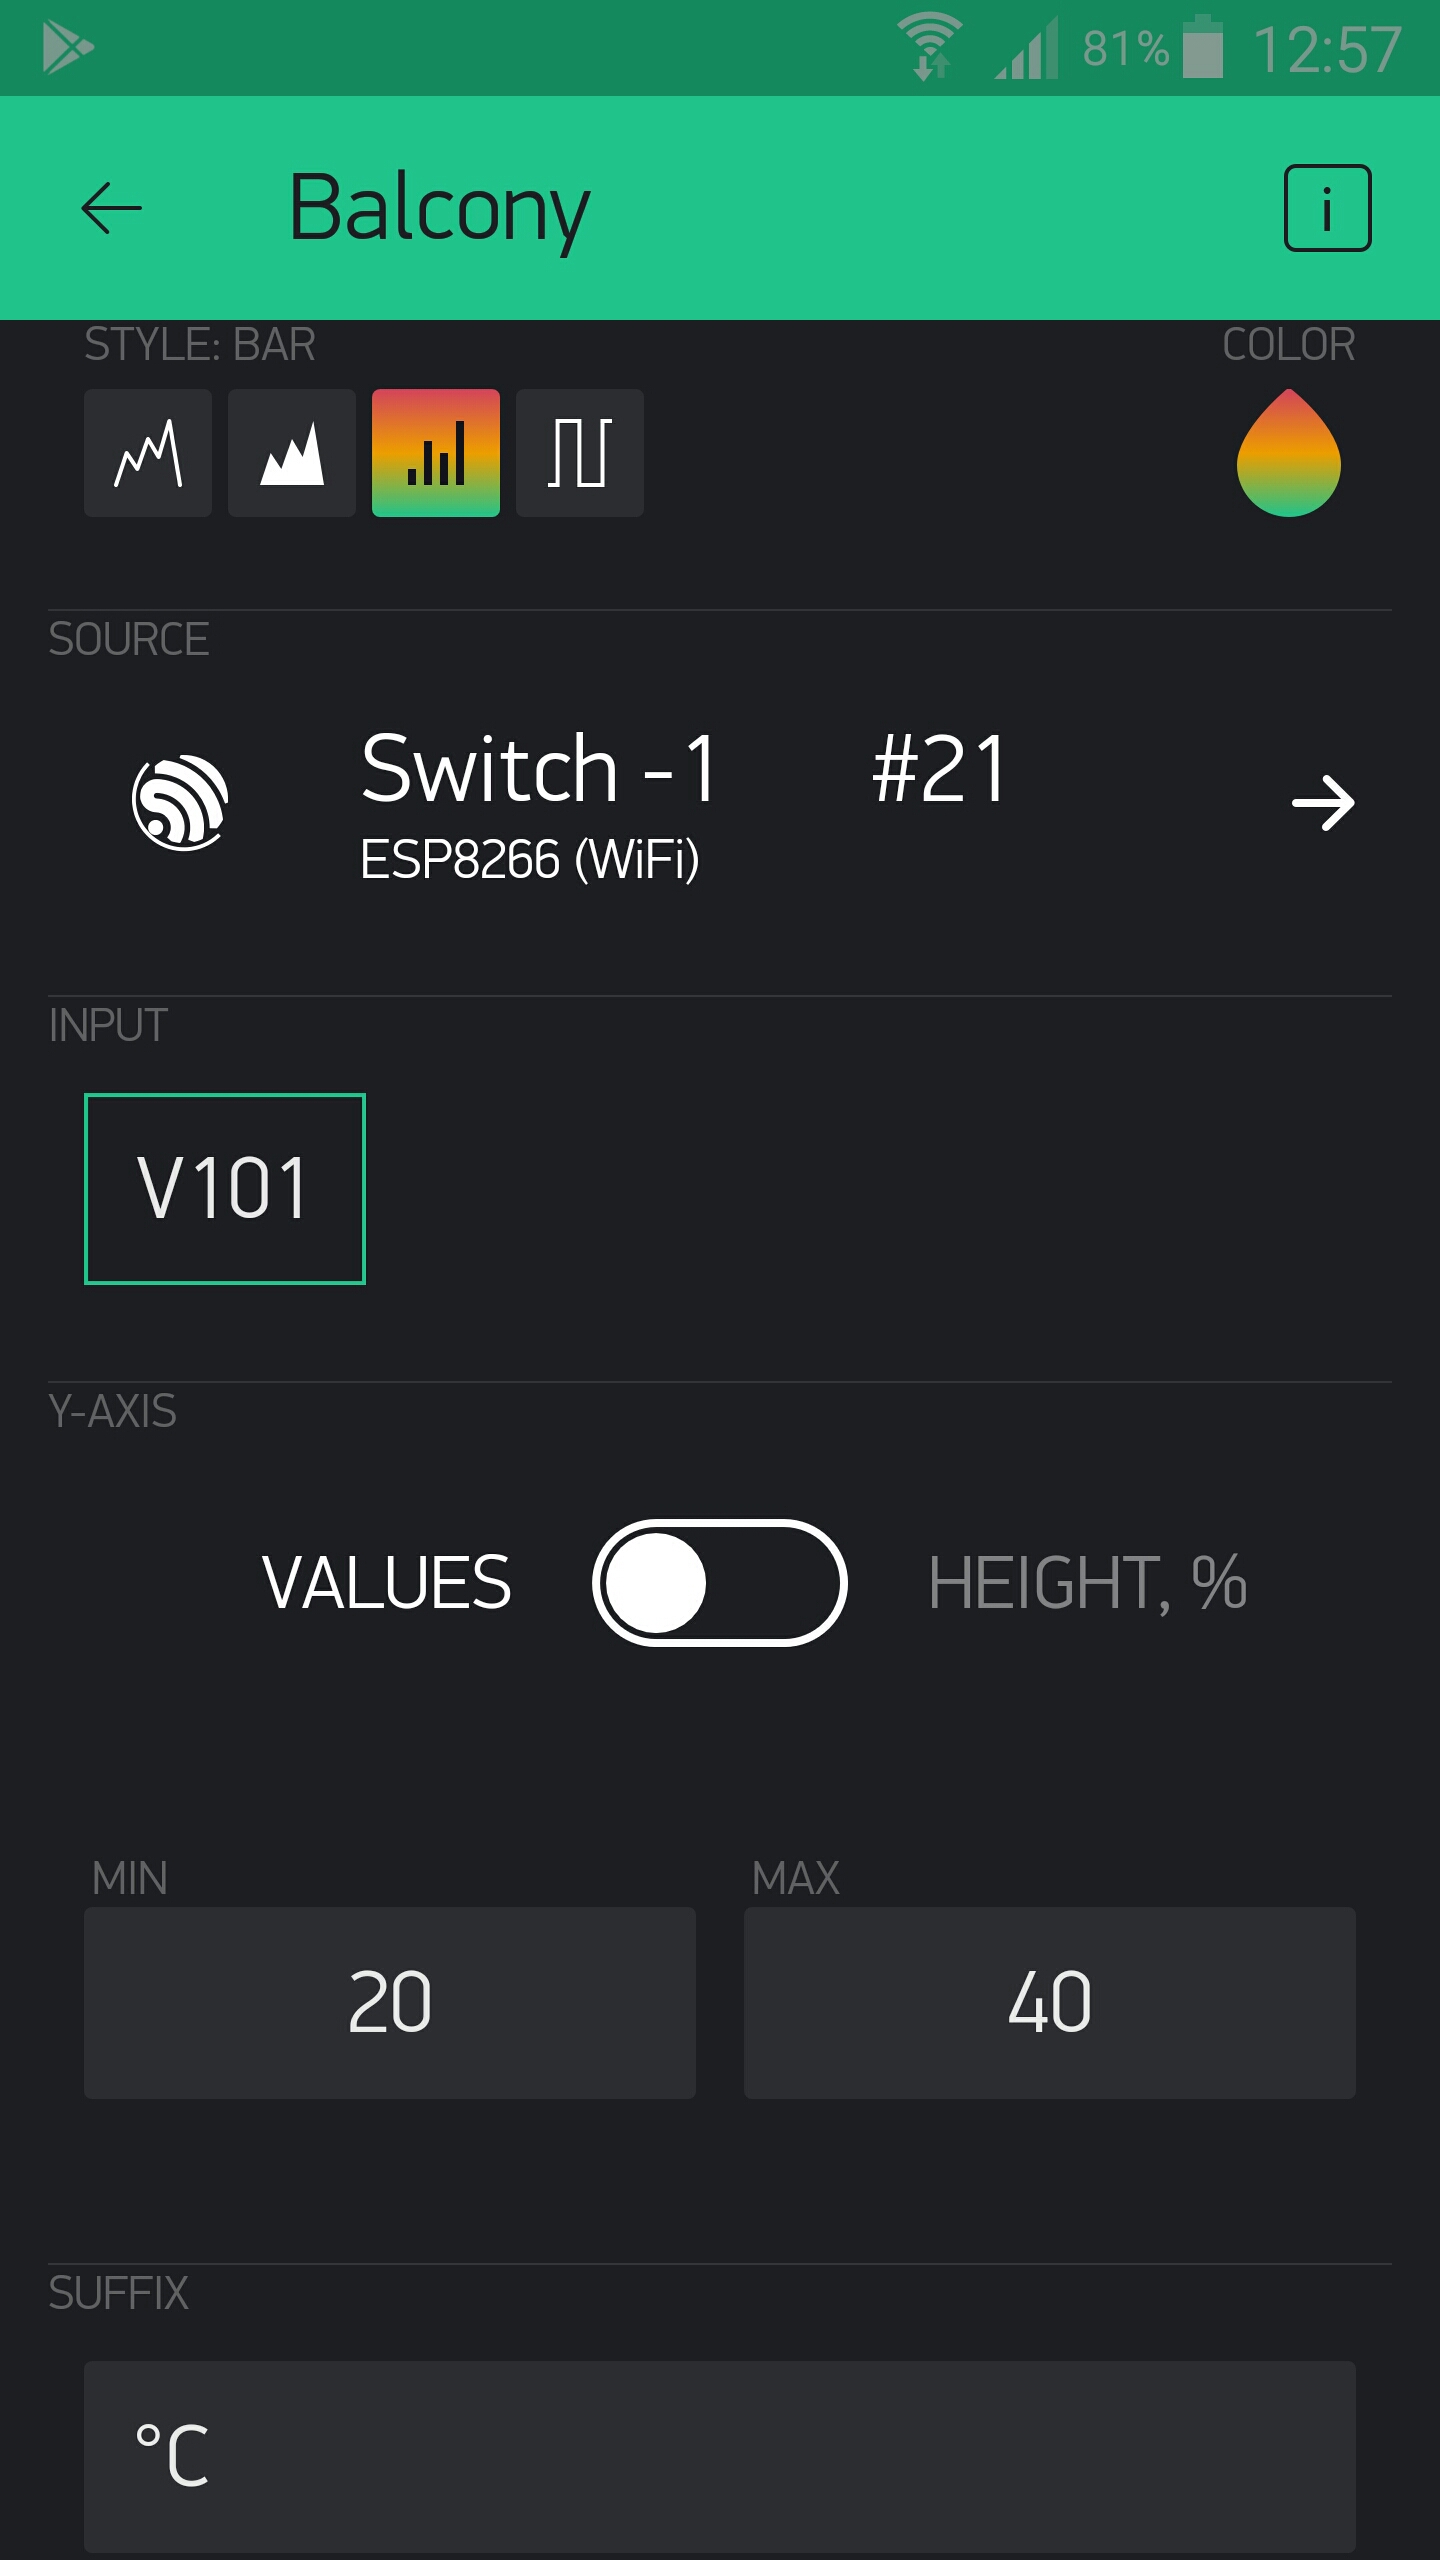
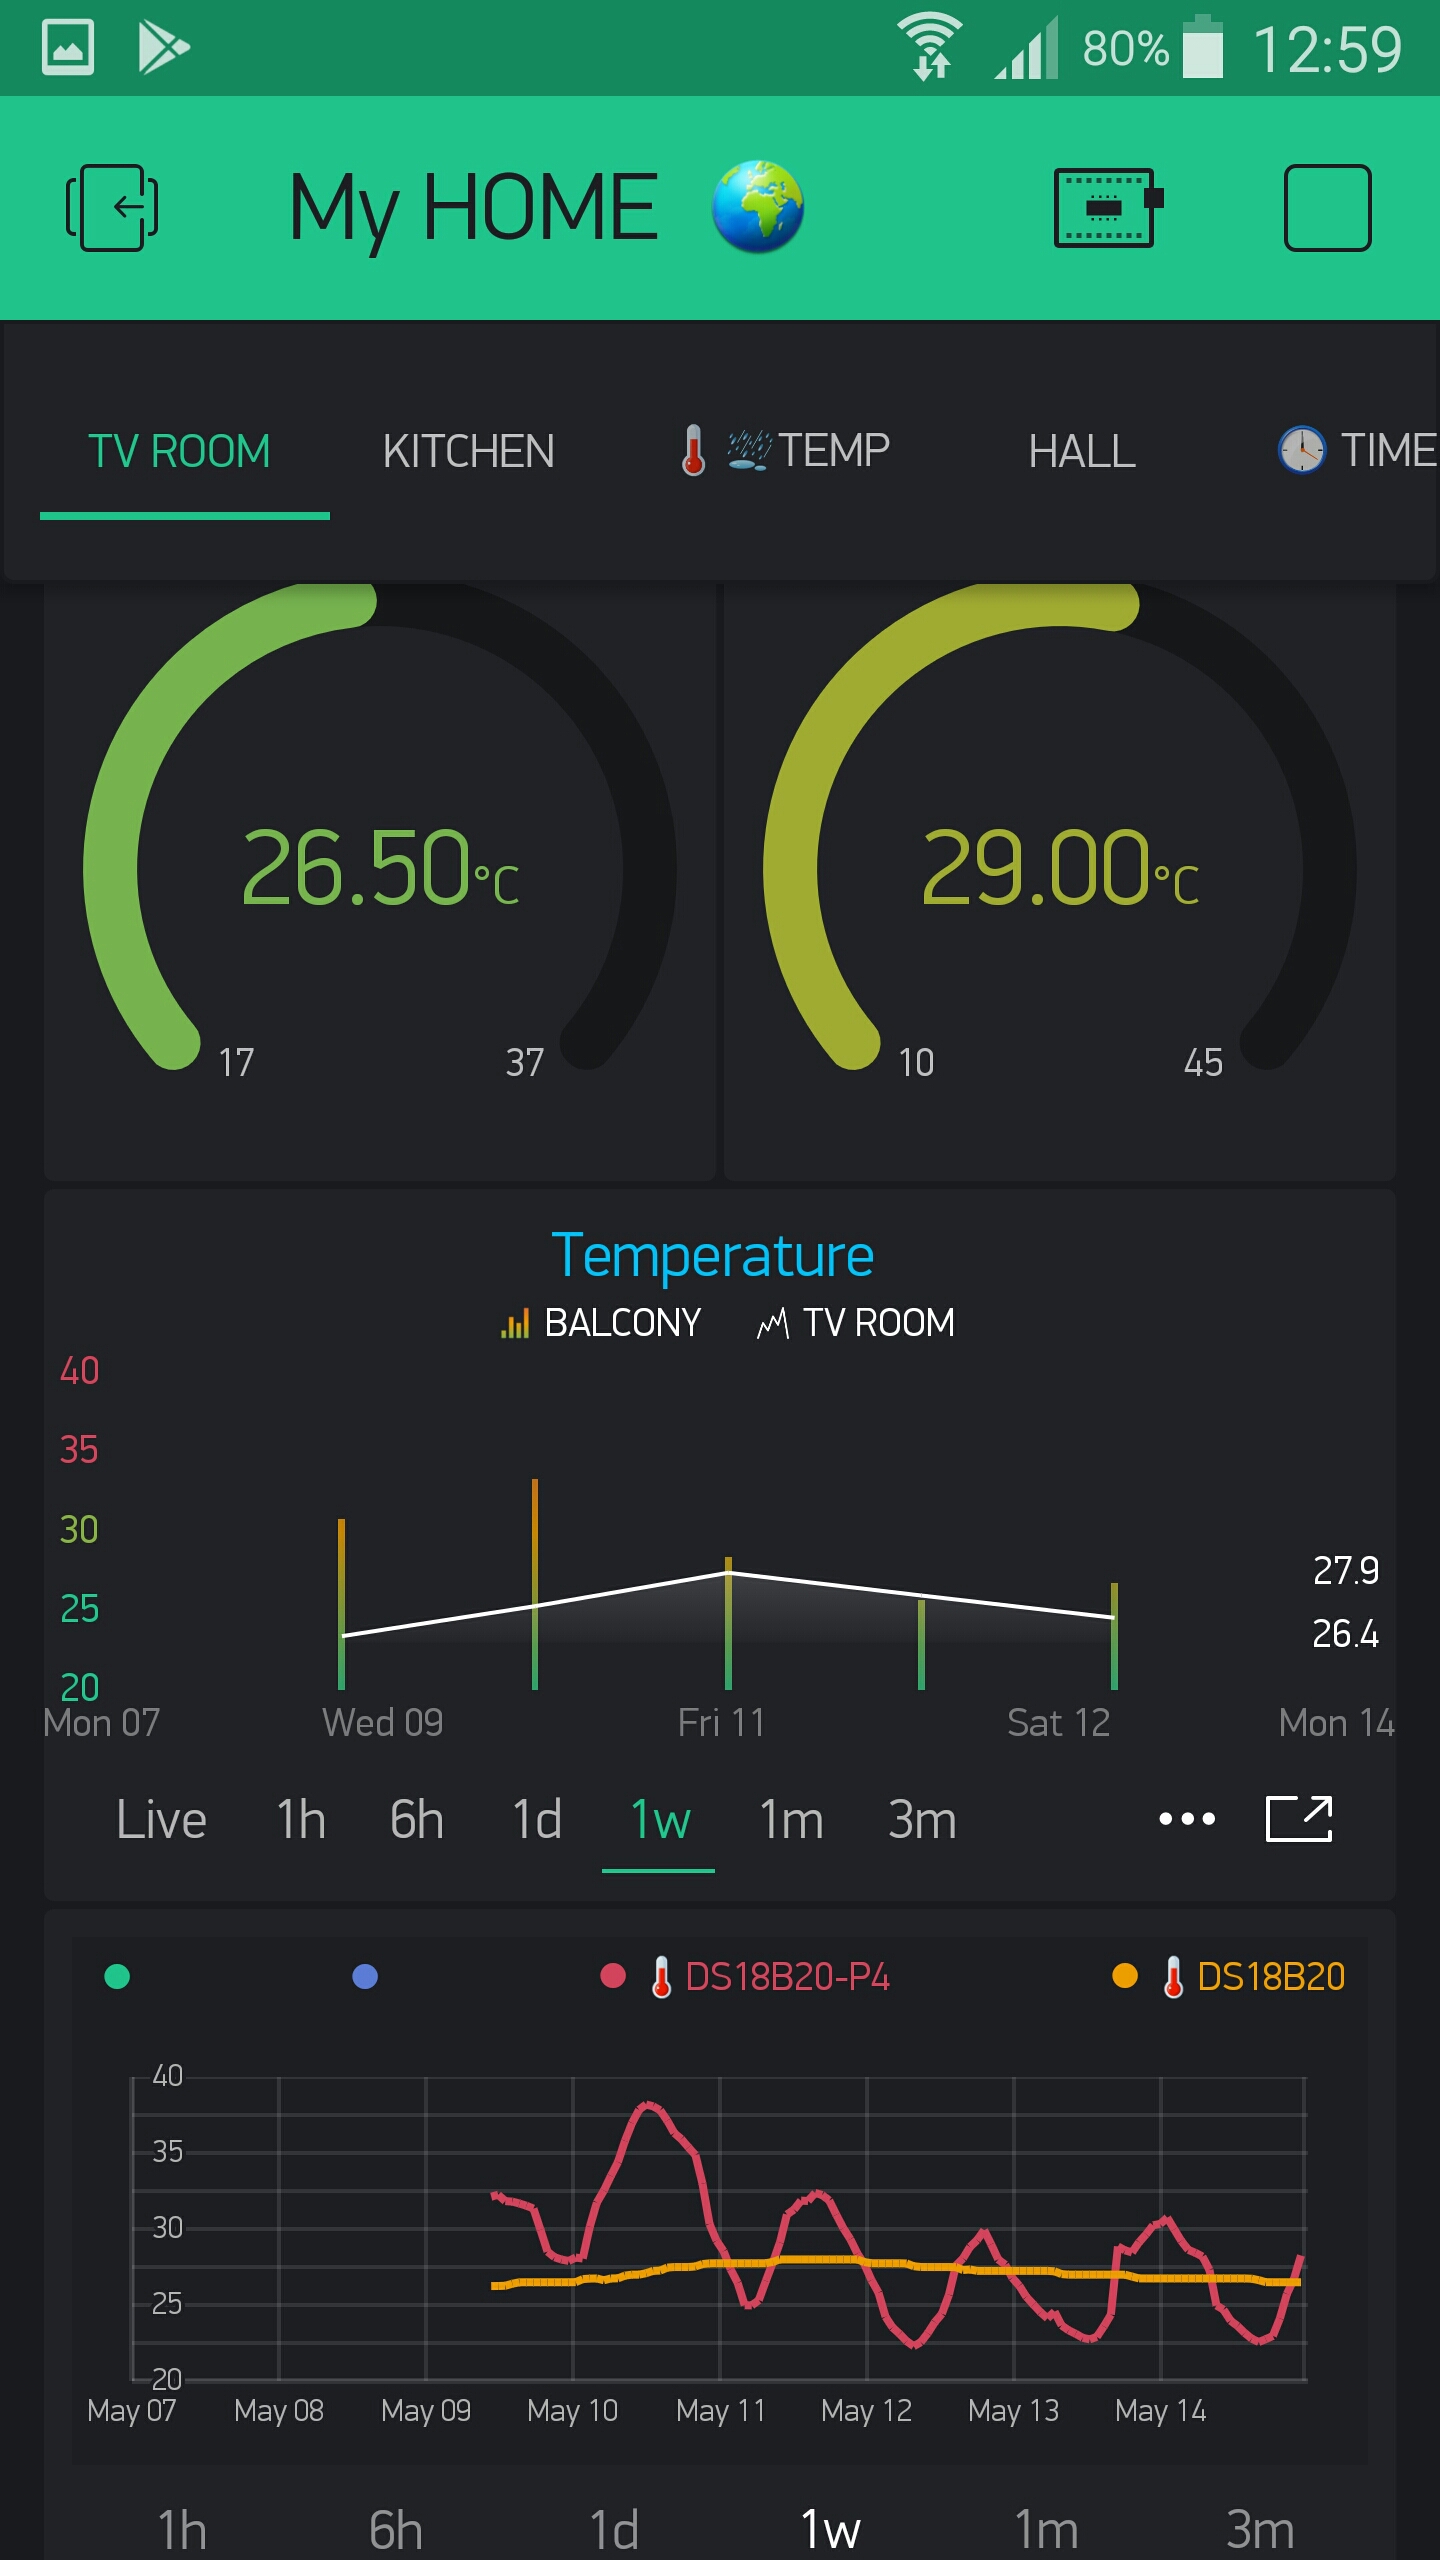
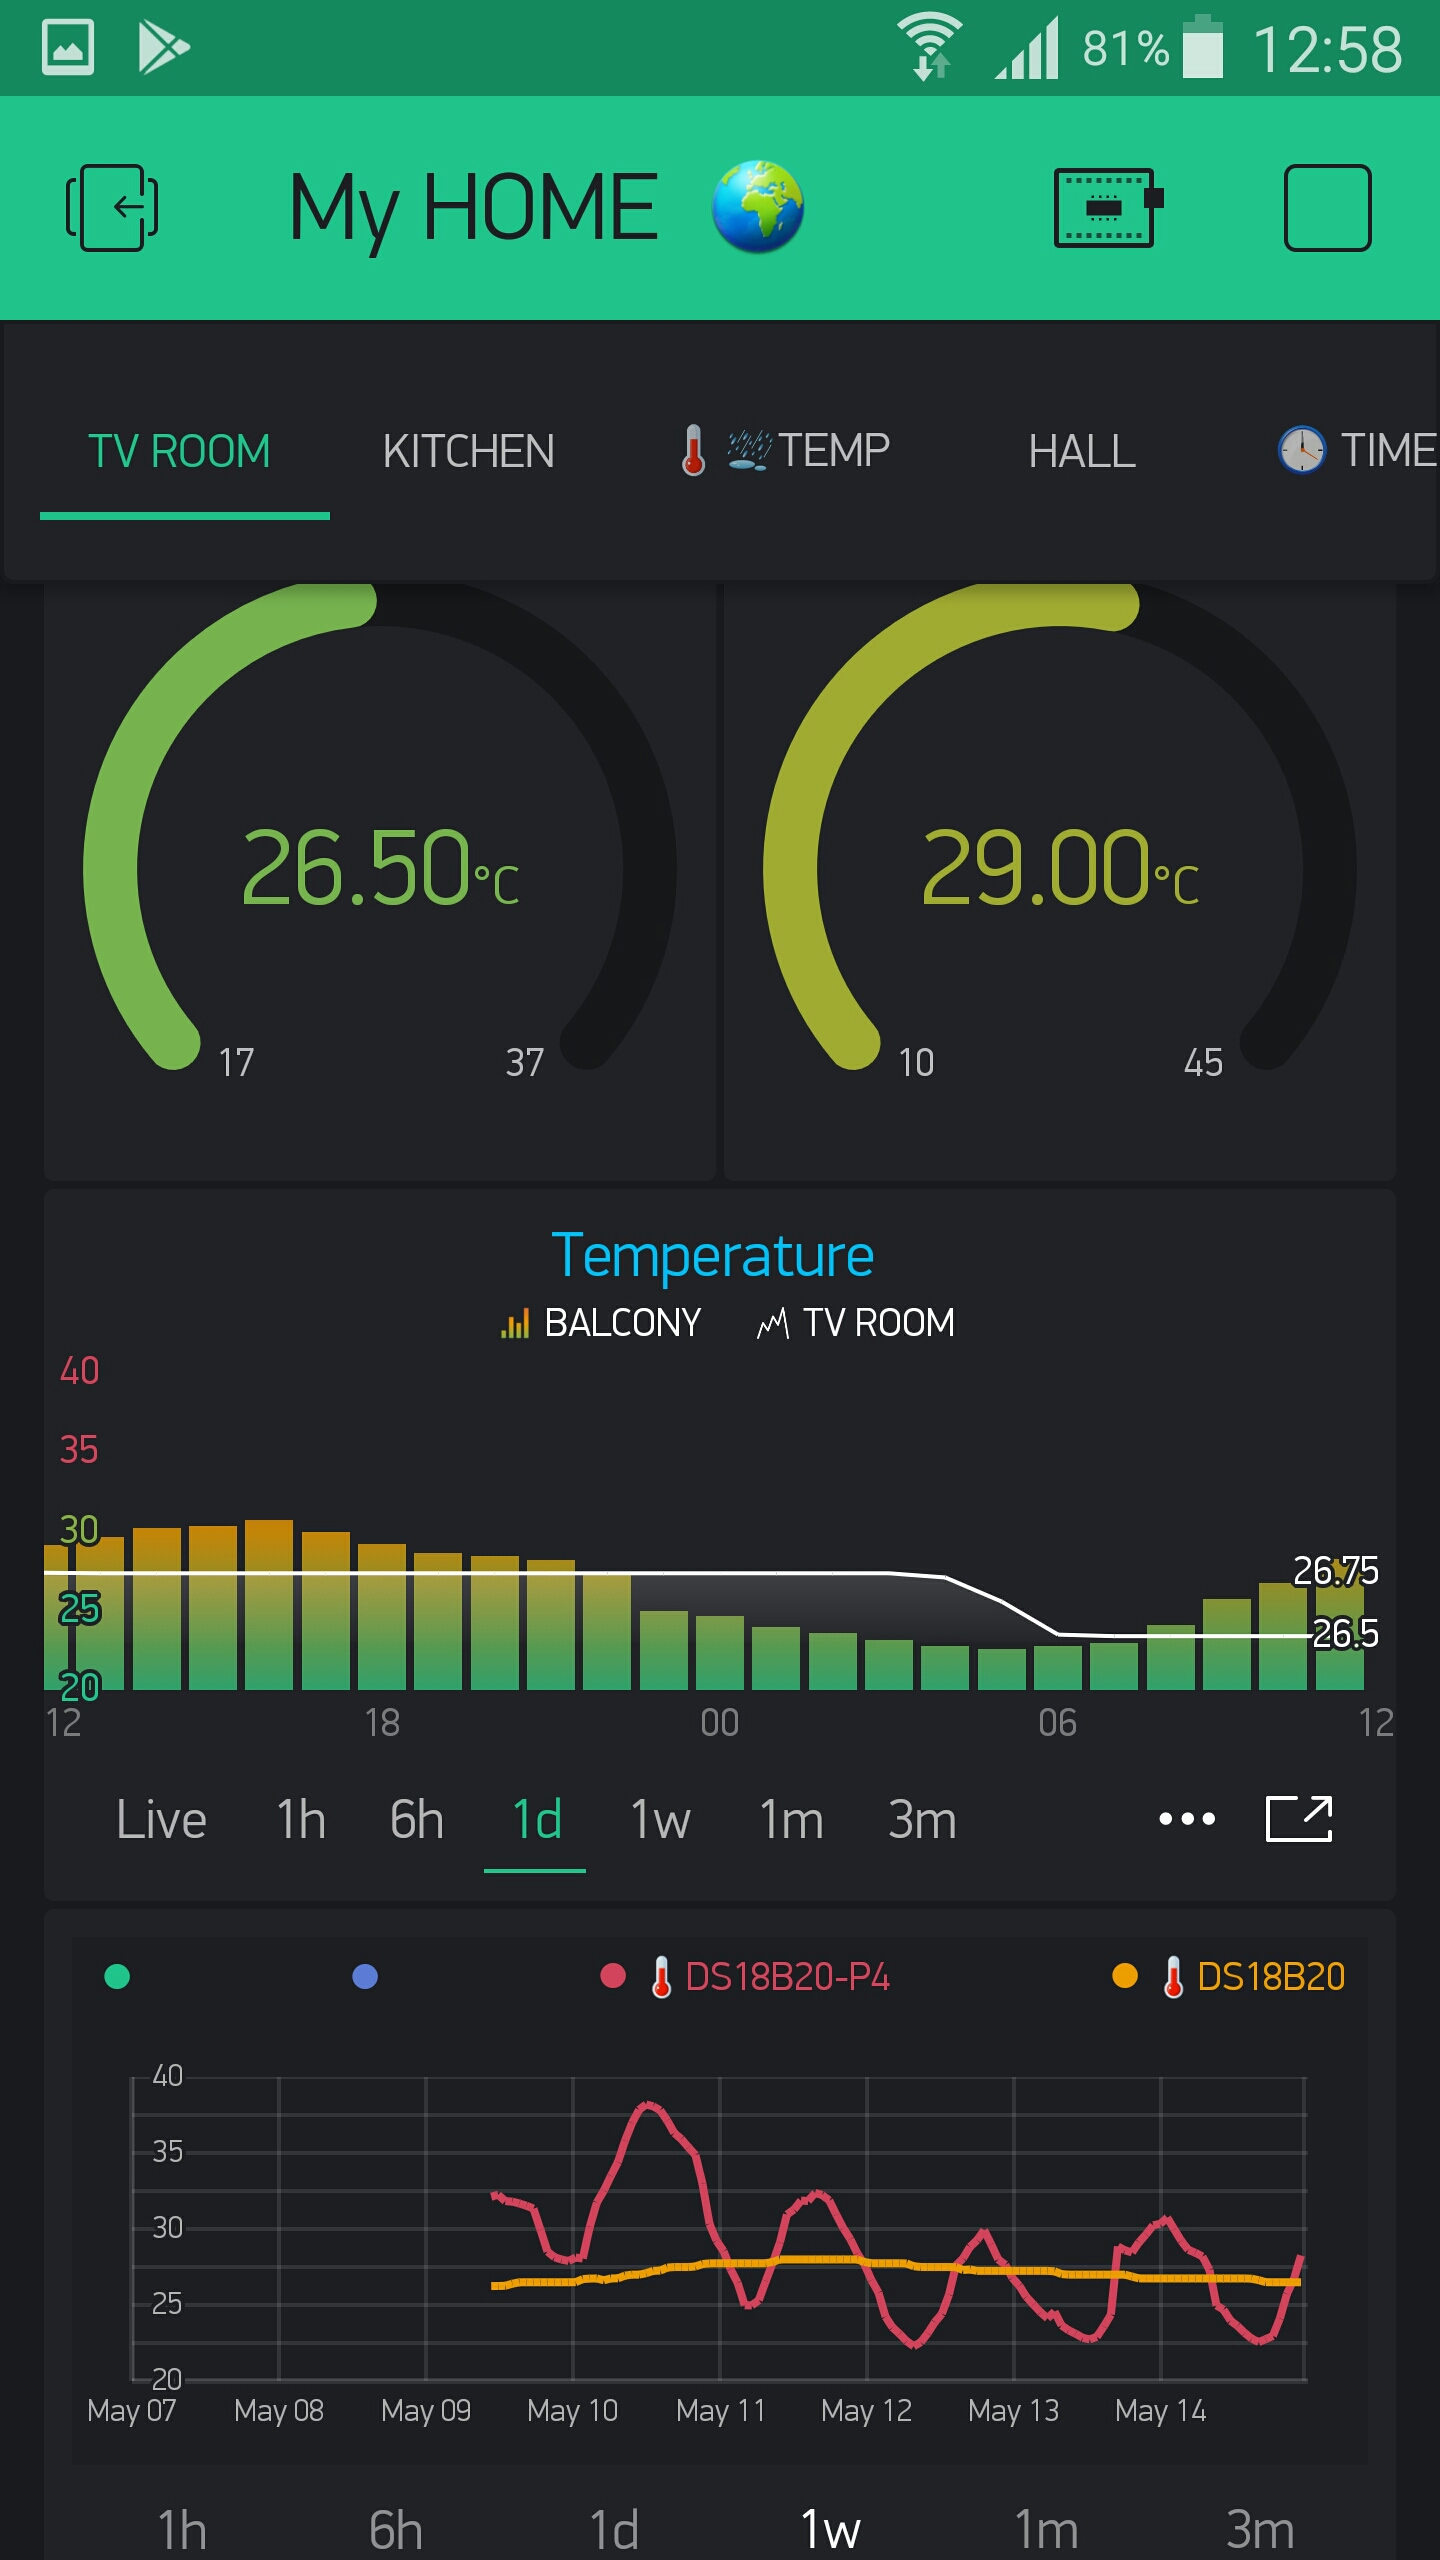
I see now, you have bar graph there. On previous release we had changed 1 week graph’s data granularity - it shows now only one value for 1 day (for 1 day - it shows 24 hours) - so it shows correct data. The only problem is - too thin bar.
Next release will contain new granularity options that could be selected.
Being able to select the high resolution periods is an improvement and it also makes you understand the difficulty of drawing such graphs for longer periods of time.
What I would be curious to know how are the data points selected on the standard resolution? For example I use the SuperChart mainly to visualize temperature and power consumption. So naturally I would like to know the peak values for a given time period.
What I’m seeing now is that highest power consumption for a water heater for a months period was 230W but in reality it was 1800W (level which it has reached multiple times during the period.
Yes obviously but what I was after was the averaging process used. But actually after posting this I found another thread with the details I was looking for, thanks!
A good tip, thanks! The problem is I have >1 year worth of data stored only on Blynk and I feel the data was better visualized prior to recent changes. But since I’m using Node-RED sending the data to Blynk, I guess I just need to get myself to setup Grafana or similar to collect the data so I can then get more in depth graphs next year.
But it would be nice feature though of Blynk could do said calculations to show on a labeled display for instance. Of course I understand the performance implications if this was used on a the cloud hosted service.
There is also built into Blynk server database storage capability. It is great, if you have a lot of data for further analyzing. It is SQL based, so possibilities are “endless” . This of course requires local server with quite a large storage capacity and good client for database querying and analyzing. The metabase is one of them, but it is a heavy package for small ARM’s - requires at least 1GB RAM.