omegab
January 18, 2018, 11:03pm
1
Hi,
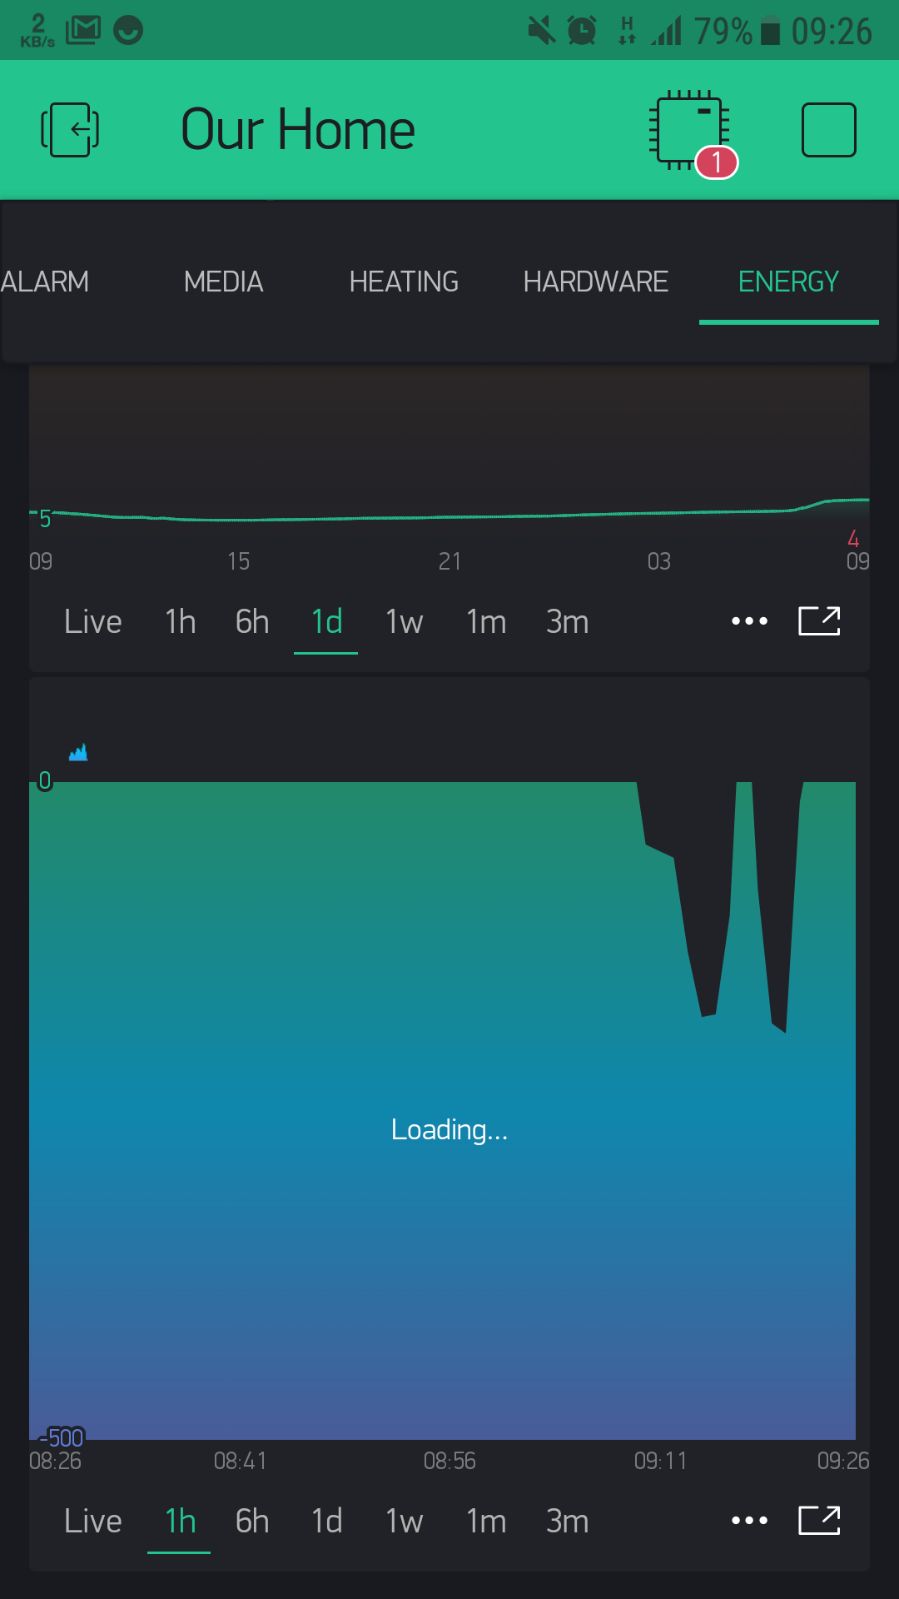
Using the Superchart, I have set the scale from -500 to 0 and the series line to FILL. However it fills always from the bottome so in essence the chart is filling in the wrong part. Particularly wrong as well if you set the scale from -500 to 500 for example.
Also, it would be great to build in the concept of a 0 Y-Axis line.
3 Likes
Pavel
January 19, 2018, 1:41pm
2
Nice effect
@BlynkAndroidDev @Eugene could you please add to “Improvements” list?
omegab
July 20, 2018, 10:27am
4
Hey guys, I’m remembering this one again - any chance in the next couple of months?
1 Like
I do recall the same applies to the gauge widget!
@omegab hm… It is still there? I thought we fixed that.
Let me answer: No it is not fixed:
@BlynkAndroidDev , another annoying “insect” in the SuperChart’s garden: A two stream graph, with split Y-axis 0-50% for one and 50-100% for another stream. They displays fine initially, look below:
[Screenshot_2018-07-17-15-05-43]
Now just scroll back in time. And what we see? Look:
[Screenshot_2018-07-17-15-06-35]
The bottom stream now shows values it never received, below “zero”
1 Like
It is still in the list of improvements for some next release
omegab
July 20, 2018, 1:32pm
9
Bonus marks if it then has different gradient colour for the positive and negative side of the axis.