My code works perfectly fine, It’s uploading the data every second. Data is being shared from one controller to another via bridge automation.
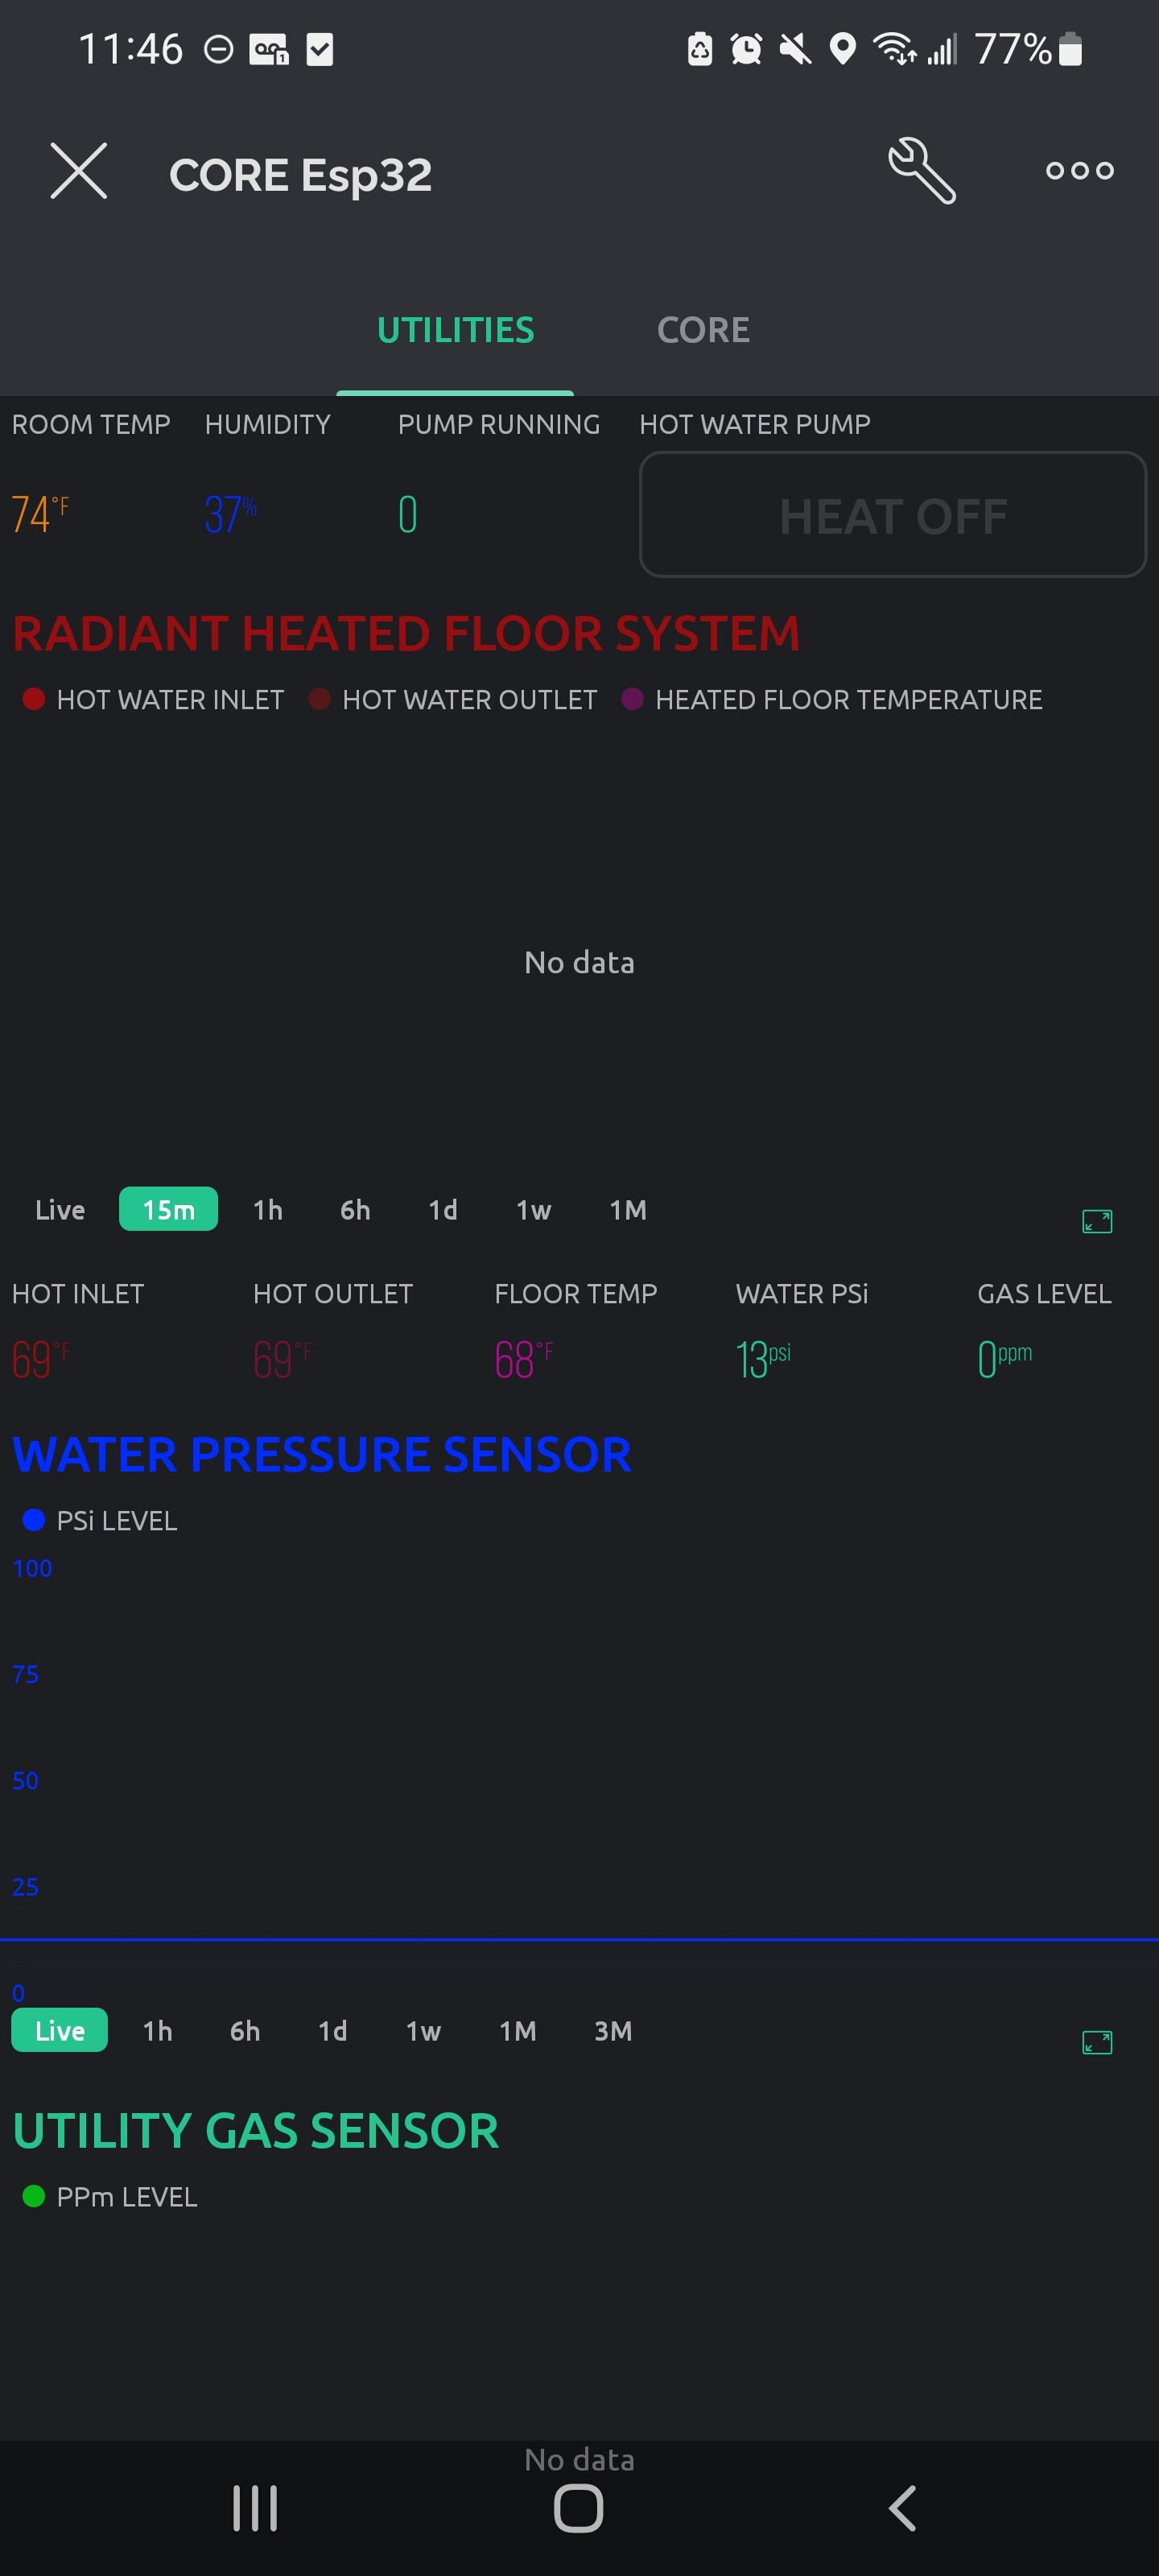
It updates every second, but it will not do any other time frame, other than live, so I have a record of data values over long term.
The only thing different from this superchart versus the others that I have, that are working perfectly fine for “INSIDE_TEMPERATURE & INSIDE_HUMIDITY”, Is the fact that this data for “RADIANT HEATED FLOOR SYSTEM” is being bridged with an automation that runs every second, on any value.
Is it due to the bridge automation that it will not keep a trend greater than live feed??
Won’t allow me to put second screenshot in of working chart, because I’m a new user in this community
sorry about my lack of information provided. have you ever heard of this issue before with s.charts only showing live data, but no other time spans, in blynk 2.0?
If so, can you give some ideas of solutions that worked and I can give it a whack to see if it works, then update you.
I checked other topics in community and couldn’t find a relevant case to this one.
Did you get a resolution to this issue?
I have the same problem, I have 3 super charts, all show live data but nothing in the other time windows, very strange
Thank you Pete, just discovered that when checking other devices I have running.
FYI I finally gave up on my local server, too unreliable. The cloud based system seems very stable.