@kostas is basing his ‘claims’ on the Superchart documentation:
Superchart supports currently 2 types of granularity:
Minute granularity - 1h , 6h , 1d ;
Hour granularity - 1w , 1m , 3m ;
This means that minimum chart update interval is 1 minute for 1h , 6h , 1d periods. 1 hour for 1w , 1m and 3m periods. As Blynk Cloud is free to use we have a limit on how many data you can store. At the moment Blynk Cloud accepts 1 message per minute per pin. In case you send your data more frequently your values will be averaged. For example, in case you send value 10 at 12:12:05 and than again 12 at 12:12:45 as result in chart you’ll see value 11 for 12:12.
That would definitely throw a monkey wrench in my theory.
I think we can all agree, we must be looking at some sort of average temperatures. This is going to tamper the spikes. We’re not looking at the actual spike temperatures in @Rodrigo_Cavalheiro’s chart. With averaging method “A” above, the resulting average will vary depending on where the spike occurred in the one minute interval. We’re not seeing this. The spikes are very consistent. With averaging method “B”, it doesn’t matter where the spike occurs in the one minute interval. The spike will always have the same effect on the average value for the one minute interval.
@Rodrigo_Cavalheiro, you mentioned that you’re sampling the temperature every five seconds. Are you sending each sample to the server? Are you performing any averaging in your firmware?
OK. That’s exactly what I was assuming and what my charts are based on. That implies the server maintains one minutes worth of samples (regardless of how many samples were received) in order to calculate the average.
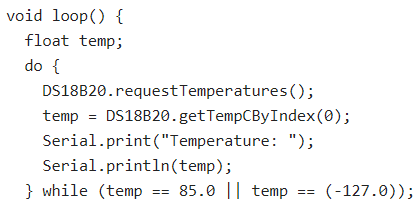
I mean, you don’t put that crap in the main loop(), it’s a recipe for disaster! And the vPin only updates if the temp reading is 85.0 OR -127.0. I don’t get it! (the complete code referred to is here)
We might be drifting away from topic… But I still believe that a +85.0 °C reading only occurs after cycling the power.
It’s a do-while loop. You read and continue to re-read the temperature until it returns a value other than 85 or -127.
I’m not advocating that you apply this logic in the loop() routine with Blynk. Or that you even apply this logic at all. I’m simply pointing out this logic is used all over the Internet to address the problem @Rodrigo_Cavalheiro is seeing. It validates the theories around 85 and -127.
(edit) Let me re-state this …
I’m 99% convinced the DS18B20 is periodically returning both 85 and -127. It may well be that @Rodrigo_Cavalheiro is having “power problems” and the DS18B20 is recycling.
The peaks are still there, but somehow they are not rendering in the chart.
I set up an automation to notify me for “when temperature > -5°C” and receive it many times a day, claiming temp = 10°C (my datastream superior limit).
We already had this discussion 5 years ago. They are buffered and averaged.
A PRO subscription allows you to specify RAW data in your datastreams, and the web-based charts allow you to choose RAW rather than Average values to be plotted.
I guess the real question is, does the temperature actually fluctuate this much, or is it your code or hardware that’s causing anomalies?
I’d be extremely surprised if that were true. I’ve yet to come across any heating or cooling system which manages to maintain an environment at exactly the desired temperature.
The question should be about how you know what the real temperature is, and what results the device is reporting once every second - and what the differential between these two values is.
The sensor you are using is quite slow in 12-bit mode, and you’ve not shared enough code to know which mode it’s operating in in this situation. My suggestion would be share the serial monitor data from your device - preferably with timestamps enabled, and to see what fluctuations in readings you are seeing at the various resolutions of the sensor or with different (longer) periods between temperature readings.
Sorry, i mean the temperatura does not fluctuate THIS MUCH.
It fluctuates on a 1-2°C during normal functioning and 8-10°C during cycle-defrost (each 2 hours)
When there’s no peaks (that triggers the notifications), the chart sugests me these fluctuations. Also, there’s the dedicated controller of the cold chamber working in parallel with exactly these parameters (1ºC hysteresis).
I don’t have the serial readings because the hardware is installed in a difficult place to reach (can I have these readings remotely?). Anyway, the readings were somewhat precises and with little fluctuations (±0.2°).
Central question: why am I receiving the in-app notification? There are no peaks and no such real temperature differences.
(I’m not hanging around here as often as I used to, but I do have a soft spot for temp sensors )
Haven’t learned anything during the past 5 years working with the DS18B20?
I think you could find answers to most of your Q’s in the thread, but a quick recap:
Yes, you should change timer.setInterval(1000L, getSendData) . The default resolution for the sensor is 12-bit, and can take as much as 750 ms to complete a reading (= your program is halted during this time).
The 12-bit mode resolution is 0.0625°C, which is an accuracy nobody needs for anything. Ever! Use 10-bit / 0.25°C and the conversation time will drop to below 200 ms.
I’d go for 10-bit and 60000L. If you really really need 12-bit, use setWaitForConversion before requestTemperatures to minimize the reading time. Regardless of chosen resolution, it’s an easy way to speed up things!
There is a link to my “Cheap(est) RF 433 …” project in the thread where you can look at the code I used for the setWaitForConversion function.
Add to that - hardware! How many sensors, using pull-ups, parasite mode, long cables…?
Pete, I’m sorry for reviving this thread yet again, but I just couldn’t resist to answer!