Might indeed be interference.
Or someone is placing their hot coffee/iced tea next to the thermometer 
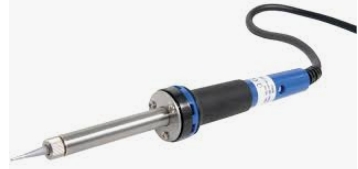
Can we see a picture of the thing?


I’ll upload more pictures tomorrow when I get to work.
BTW, all the schematic is hidden from people messing around.
You just have to live with it! Reading each sensor every 5 second yields a whopping 34.560 reads every single day(!). If you didn’t have any anomalies among those, that itself would be an anomaly IMHO!
In the DallasTemperature.h you can see that a loss of communication results as these values as an “error code”:
// Error Codes
#define DEVICE_DISCONNECTED_C -127
#define DEVICE_DISCONNECTED_F -196.6
#define DEVICE_DISCONNECTED_RAW -7040
Does your spikes correspond to any of those values?
Are you feeding your sensors with 3.3 or 5 V and are they in a parasitic configuration?
My standard tips for the DS18B20 is to lower the resolution a bit (10-bit is 0.25 increments) to speed things up. Use the DS18B20.requestTemperatures() function to speed things up even more ![]() Talk to your sensors with their individual address.
Talk to your sensors with their individual address.
Can you post your complete sketch? Sometimes you’re blind to your own code so a peer review never hurts! ![]() Unless you’ve made an embarrassing error
Unless you’ve made an embarrassing error ![]() We’ve all been there hehe
We’ve all been there hehe
2 Likes
So what’s not running at night? Fluorescent lighting? Motors (e.g., blowers, …)? Pumps?
Even if you can eliminate most of the interference, I still think it makes sense to guard against bad samples.
I definitely think it’s worthwhile to evaluate whether all of the bad samples involve failed CRC checks. I suspect they do. It’s not that the samples are inaccurate. They’re simply garbage. The CRC check let’s you easily identify these bogus samples.
Again, try to identify the root cause of the interference. However, even if you think you’ve eliminated the source of the interference, there’s absolutely no harm in guarding against future interference.
Keep us updated,
Joe
Btw, to me the fact that the error patterns seem to line up between the two thermometers is pretty strong evidence that it’s interference.
The high peaks could also be explained by someone opening the cold chambers at similar times, but that wouldn’t explain the dips.
You might try to wrap the wire that comes out in tin foil to shield it a little and connect the foil to the GND pin, and see if it does it any good.
Careful to not short anything with it.
Also, maybe put a ferrite core filter on the power cable coming in.
Filtering the error with logic as some suggested is also a good idea, but I like physical solutions
I also suspect some other electric device (computer monitor perhaps) is causing interference. Ensure the wires to the probes are twisted together and well shielded.
I think the problem is the wire between the Arduino UNO and the DS18B20’s. How long is this wire? It’s running through the wall adjacent to AC wires (e.g., light switch)?
If I were you, I’d jettison the Arduino UNO. I’d dedicate a $2.50 NodeMCU (12-E) to each DS18B20. And I’d either stick each NodeMCU / DS18B20 directly into the cold chamber or I’d co-locate the NodeMCU’s directly adjacent to the cold chambers. Can you get 5VDC into the cold chambers (obviously you can … that’s how it currently works)? Would the construction of the cold chambers allow wi-fi connectivity?
The operating temperature range of the ESP-12E is -40 °C to 125 °C. You’d need to check the operating temperature range of the NodeMCU. For $2.50, it would be worth a try.
You won’t believe. As I put my hands in the hardware it stopped spiking. That way, I suspect some kind of bad pins connections  .
.
What’s weird: why would the hardware work well during night and spiking in the morning/afternoon?
@distans spikes are around 12-15 degrees from actual temperature. Never -127°C.
DS18S20 are plugged in to 5V and GND. I believe my error was embarrassing 
@wickedbeernut Great point. What’s not running during night: fluorescent lights, motors (it’s a industrial kitchen), some computers (6 or 7).
@Gspin Yes! Opening the chambers brings variation, but they’re much softer than the spikes. Opening door and spikes are not simultaneous. As soon as the DS18S20’s leave the board they don’t run togheter.
@wickedbeernut Yes! I’ll try another approach in 2 cold chambers that are not monitored yet.
Thanks to all of you! You’re great!!
Your hands likely served to ground it.
Or perhaps a loose connection, that when the door opens/shuts wiggle the wires going to the board?
Just to share a few info about DS18B20.
As it has been already mentioned, temperature measurement is effected in two stage.
Temperature conversion
Reading of the result
When temperature conversion is not successful, reading the result always returns a +85 result (this value is hardwired into DS18B20’s logic).
This explains the rising spikes.
Main cause of unsuccessful temperature conversion is insufficient power supply, either when DS18B20 is parasite or externally powered.
I guess crc error checking is already applied into OneWire as well as DallasTemperature libraries.
CRC is supported by OneWire, but I wouldn’t say it’s already applied. The application needs to invoke OneWire::crc8 to check CRC.
“Say hello to my little friend!” ![]()
Isn’t there a very big noisy motor driving the cooling system?
I’m not sure about that. According to the datasheet, that’s the power-on reset value, and his spikes are only 12-15 degrees anyhow. So it doesn’t fit ![]()
Just to elaborate on my previous post and the “-127 C” error. It’s also true if the scratch pad can’t be read successfully (from DallasTemperature.cpp):
// returns temperature in degrees C or DEVICE_DISCONNECTED_C if the
// device's scratch pad cannot be read successfully.
When you have eliminated all possible EMI sources, try moving your ESP8266 a foot or two away from the board. Or learn to live with it ![]()
Actually, 3 of them, but they work at night too. So, the interference might not be from them.
Bingo! I use a panel-mount waterproof enclosure the size of a large matchbox. I have a custom board which the NodeMCU plugs into, mounts to the bottom of the enclosure on standoffs. Stick the whole darn thing in the cold chamber. This is in the true spirit of IOT. Have a third cold chamber? Stick an enclosure / ESP8266 / DS18B20 in there, too. All of the devices function completely independent of one another. Less than $10 for the entire assembly.
1 Like
Don’t get me wrong, I’m all for a sound electronic environment with minimal interference from other sources. But as I wrote before, it’s $10 of hardware you’re working with. And I think it’s strange that your values only jumps 10-15 degrees and not giving you the “-127” as a real error… 
If you have a florescent lamps, change the glow switch starters to those electronic versions. It fixed my problems with a black screen every time someone turned the light of in the bathroom 
1 Like
@Rodrigo_Cavalheiro
his spikes are only 12-15 degrees anyhow. So it doesn’t fit
Consider that graph values are per minute.
If you send to the server more frequently, server records the one minute average.
1 Like
He’s sampling the temperature every 5 seconds. A spike of 12 degrees over a one-minute interval with a running average temperature of 6 degrees corresponds to one bad sample of 78 degrees,
(6 degrees x 11 samples + bad sample) / 12 samples = 12 degrees
bad sample = 78 degrees
Pretty darn close to 85 degrees.
1 Like
Definitely appears to be a grounding or interference issue. Look for a cold solder connection. Also, filtering bad measurements is poor practice because it hides problems. You always want your raw measurements to be correct. Just my opinion.
1 Like
I’d like to revisit @kostas’ assertion and my observation as it relates to a temperature of +85 degrees …
and expand on @distans’ assertion and include a second observation related to a temperature of -127 degrees.
My observations are based on @kostas’ assertion that what we’re looking at in @Rodrigo_Cavalheiro’s charts are one minute averages.
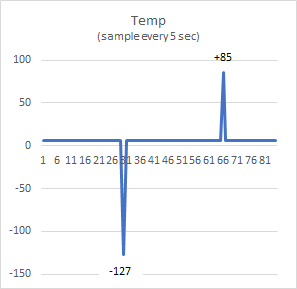
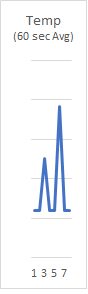
This chart depicts a steady state temperature of 6 degrees. As is the case with @Rodrigo_Cavalheiro, the temperature is sampled once every five seconds. I’ve inserted two “temperature spikes”. One spike is -127 degrees and the other is +85 degrees,
Clearly, this isn’t what we’re seeing in @Rodrigo_Cavalheiro’s charts. However, if rather than charting each temperature sample every five seconds, what if we consider the average temperature over one minute intervals as @kostas claims? The chart looks like this …
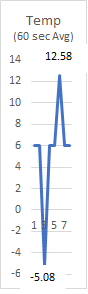
Note the spikes. The one minute interval containing the -127 degree spike has an average value of -5.08. The one minute interval containing the +85 degree spike has an average value of 12.58. Does this look familiar? Compare this to @Rodrigo_Cavalheiro’s original chart (in orange),
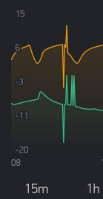
In @Rodrigo_Cavalheiro’s chart, at the time of the spikes, the steady-state value is approximately 6 degress (as with my example). The one minute interval containing the first spike is damn close to -5 degrees. The one minute interval containing the second spike is damn close to 12 or 13 degrees.
Of course, if two spikes occur in the same one-minute interval, the average is roughly double,
Compare this to (in green),
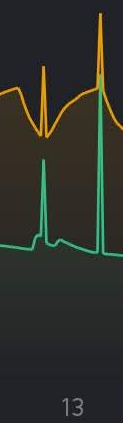
Look familiar?
I think there may be some truth to the +85 and -127 theories.
1 Like