I did a dive through the documentation and a quick search through the forums, but I am not sure if I am missing something simple
Thanks to the supply chains of the world ceasing to exist we are in the midst of updating several products. We ended up moving from RPi to uC running arduino for some of the lighter use devices. Since it is now a bit more fun to manage configuration changes (and we were moving towards cloud based device management anyway) this seemed like a good time to start looking at a basic platform that would allow us to manage and deploy these remotely.
Blynk seems to be the closest thing I have seen so far to a platform that meets our needs for deployment, management, updating, and collection of the very basic use metrics we are interested in!
We collect very little sensor data and are mostly just interested in error event notices and system uptimes. The major use for us is the ability to deploy and configure the devices remotely. To that then I have two items that seem like they should be straight forward, but I am maybe missing something.
While I see it is available to do simple text input boxes in the App, the web dashboard only allows sliders?? Our support team can I suppose do the settings from their phones if necessary, but is there a way to accomplish say entering an IP address to update on the device - from the web - without resorting to a set of sliders? (The module interface looked promising, but that is still a incremental input). Not a showstopper, but seemed to be a missing pice so I figured I’d ask.
One of the settings on our devices returns a rf frequency plot as an array to visualize the results of the changes made. (100 data points representing 100 frequencies and the level at each). Plotting this to a chart would very much be the ideal, but if I am reading everything correctly only time based data can be charted? Again, not critical, but a nice VSWR chart it easier on the support department than just saying “peak value was xxx at xxx frequency”…
Overall I am liking the product and it seems a good fit for the smaller nature of what we need for this equipment!
Perhaps it is because I don’t have them connected to a device, but they are display only for me. Can you update the text in the from the Web Console (send a new value to the device)?
I suppose it is possible to send the 100 values over 10 seconds (if I have read the data throttling limits correctly) but without a way to label the x axis in anything other than time it is a bit clunky. I am still playing with work arounds for that, I guess Iwas just hoping I was maybe missing a way to push a 2d array to the charting
I think you are right it is read only for the text. I would like it to be able to have the same widgets as the device, I am not sure why it has these limitations:(
I am looking at maybe just making a web app to consume the array for that one piece and just open a new window. HTML5 or JS can easily draw the graph. Most of the other platforms I looked at have some provision for attaching custom html / JS to the dashboard, and there are hints of that here, but nothing that seemed documented.
Yeah, that was pretty much where I was looking. Honestly, the lack of text boxes or list menu’s is more annoying … I guess I will just have to train our support staff to get out their phones!
The workflow is that an adjustment is made to the tuning of an antenna (sliders work well here at least) then a plot of the new response curve is sent back. Further adjustments are made until the tuning is correct. With a human looking at the plot tuning can be done in maybe 5-10 tries. Originally, we were going to just automate the whole process, but there are 6^32 tuning combinations (at about 50ms each try) if we brute force it and refining a search algorithm for the limited number of these we are going to produce isn’t worth it. For the first batch it is looking like we will just return the 2 important numbers and just have to imagine the graph
the tuner could update one set of sliders and the other set could be used as the returned data. It would be just a graph of the data. It can be very quickly updated and look like a real time graph.
normally we work off a plot something like this, and just move the blue dip as close tot he bottom and center as possible. Easy enough to train once someone knows which knobs make it go where. Returning just the min peak and what frequency it happened at is enough to work with, just not nearly as intuitive.
yeah, I get it. For a personal project I would likely do something like this. For a work project I will just get asked why we didn’t write an MQTT bridge to fix the connection from Arduino to Azure
I think Blynk will get us close enough to what we need to be useful, and hopefully the commercial aspects will continue to grow!


 … I guess I will just have to train our support staff to get out their phones!
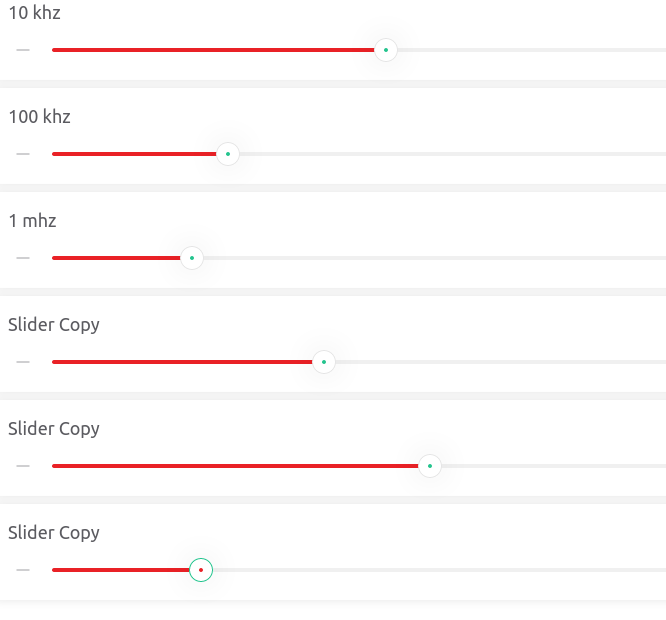
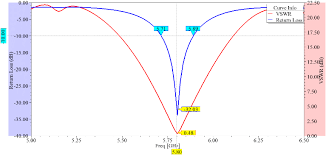 normally we work off a plot something like this, and just move the blue dip as close tot he bottom and center as possible. Easy enough to train once someone knows which knobs make it go where. Returning just the min peak and what frequency it happened at is enough to work with, just not nearly as intuitive.
