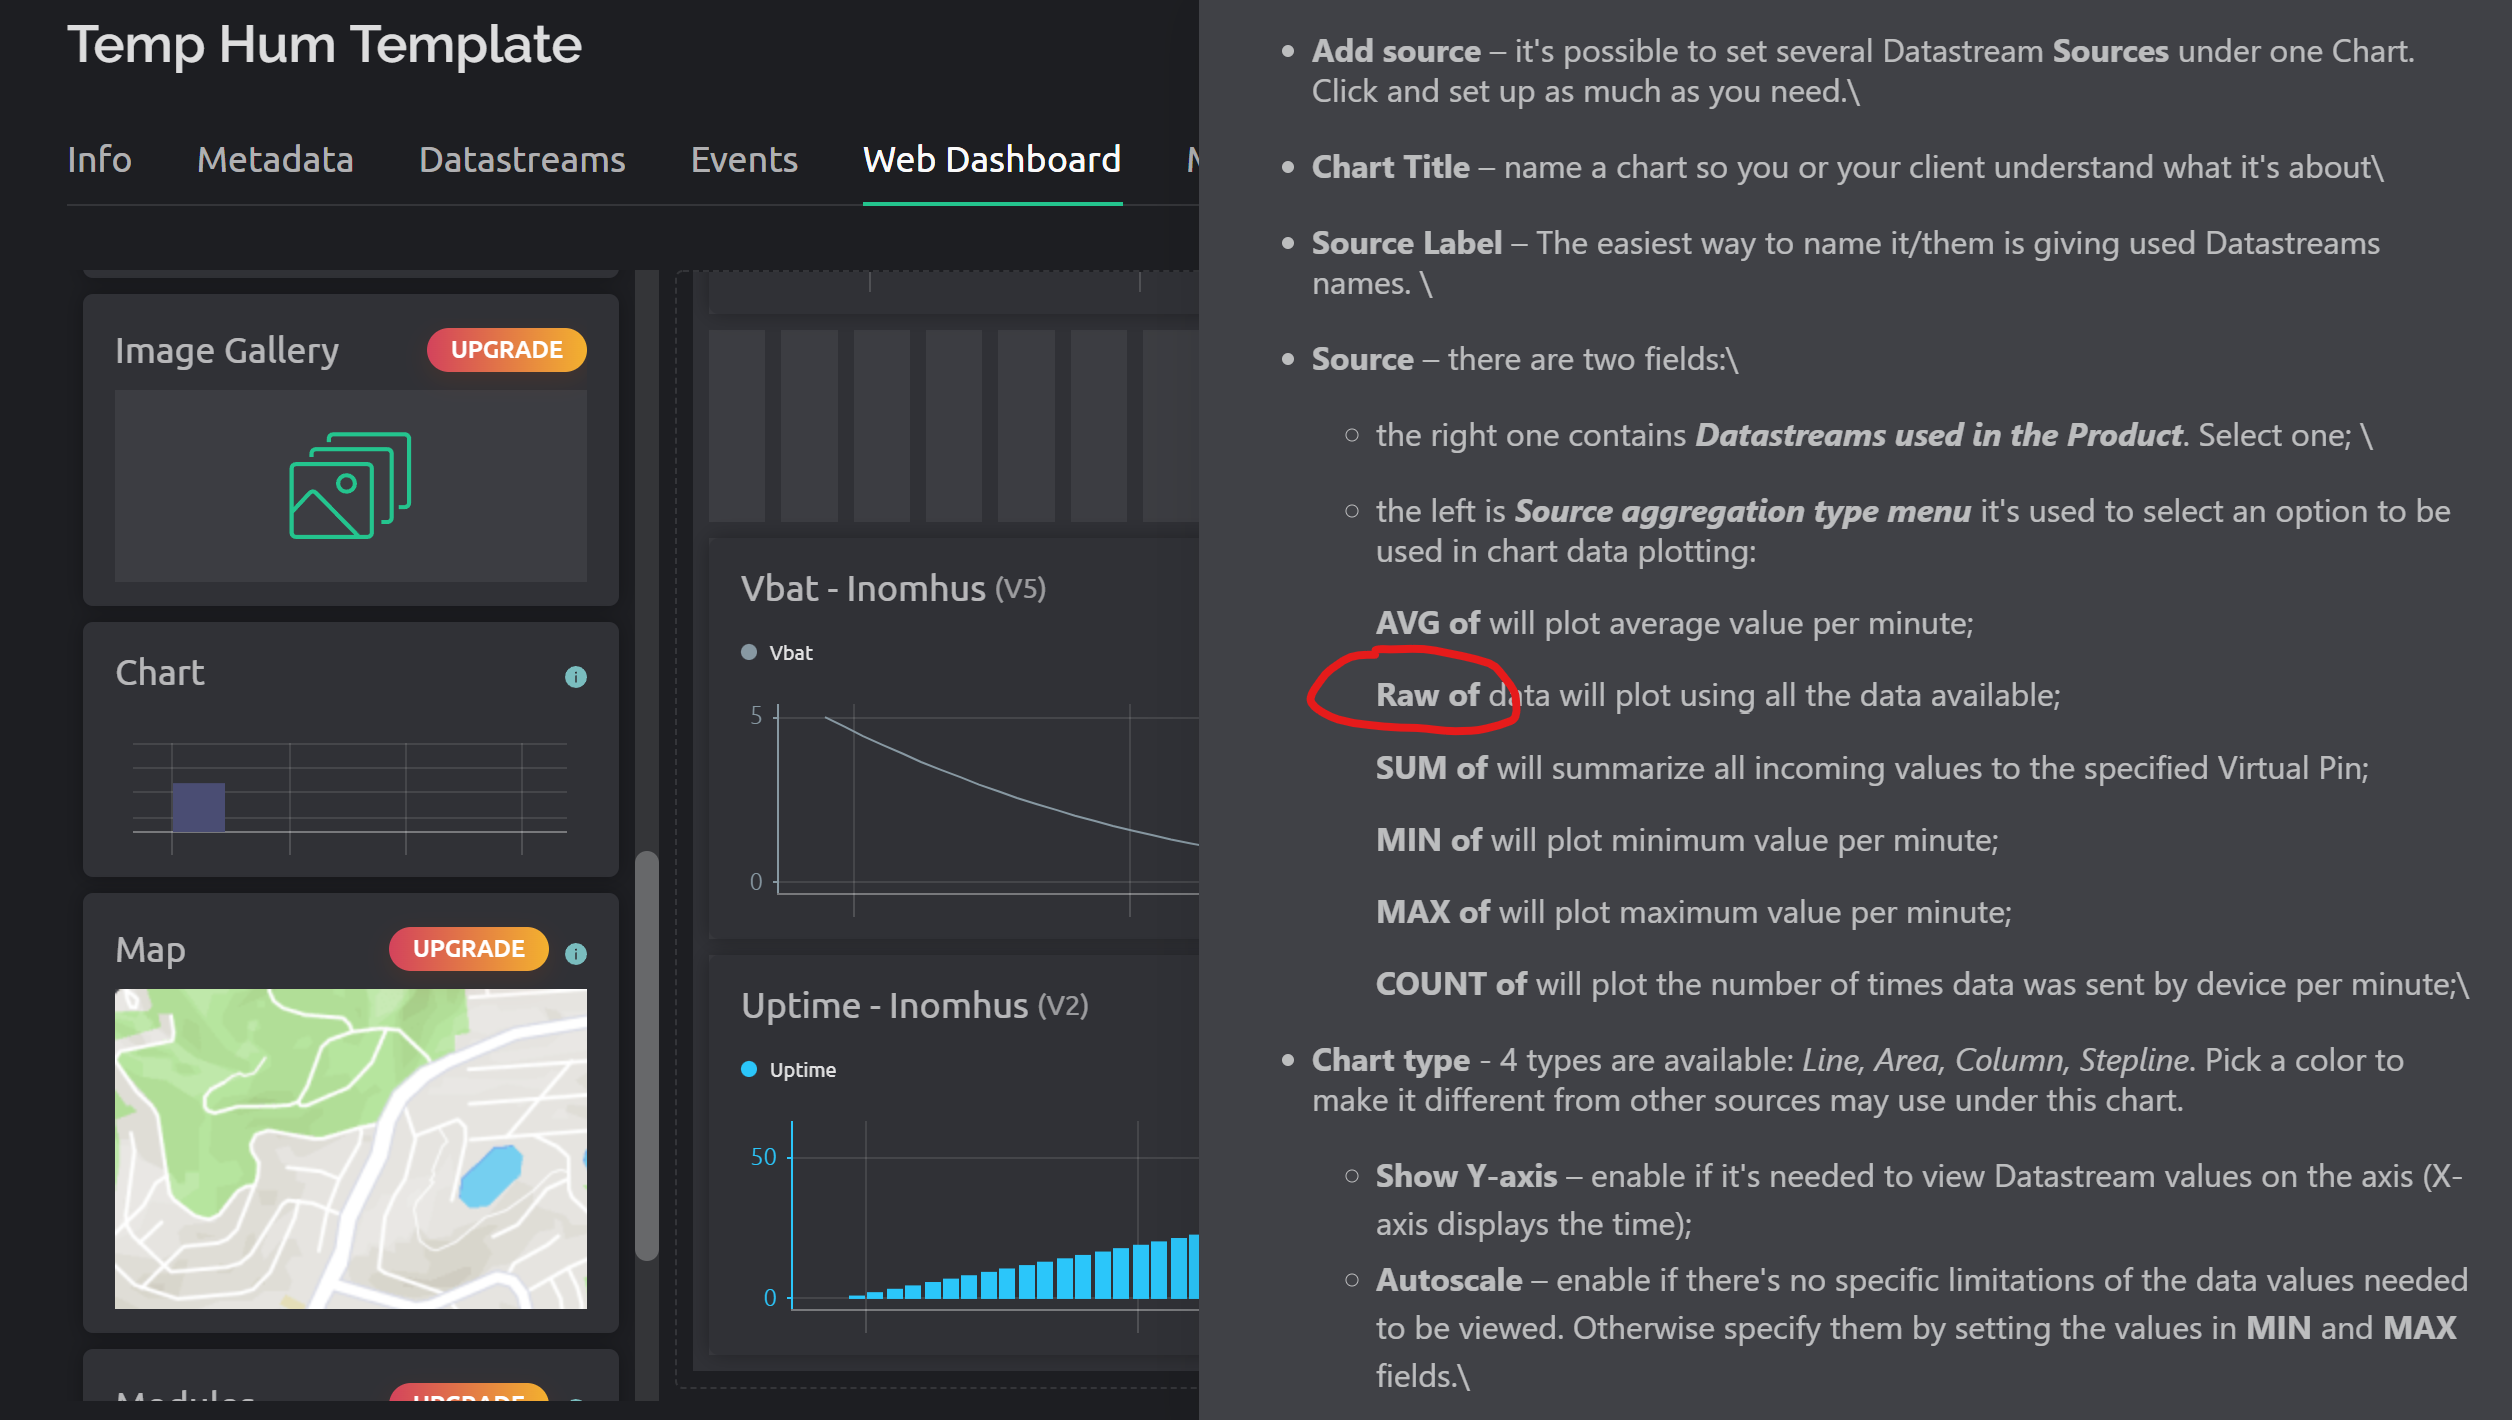
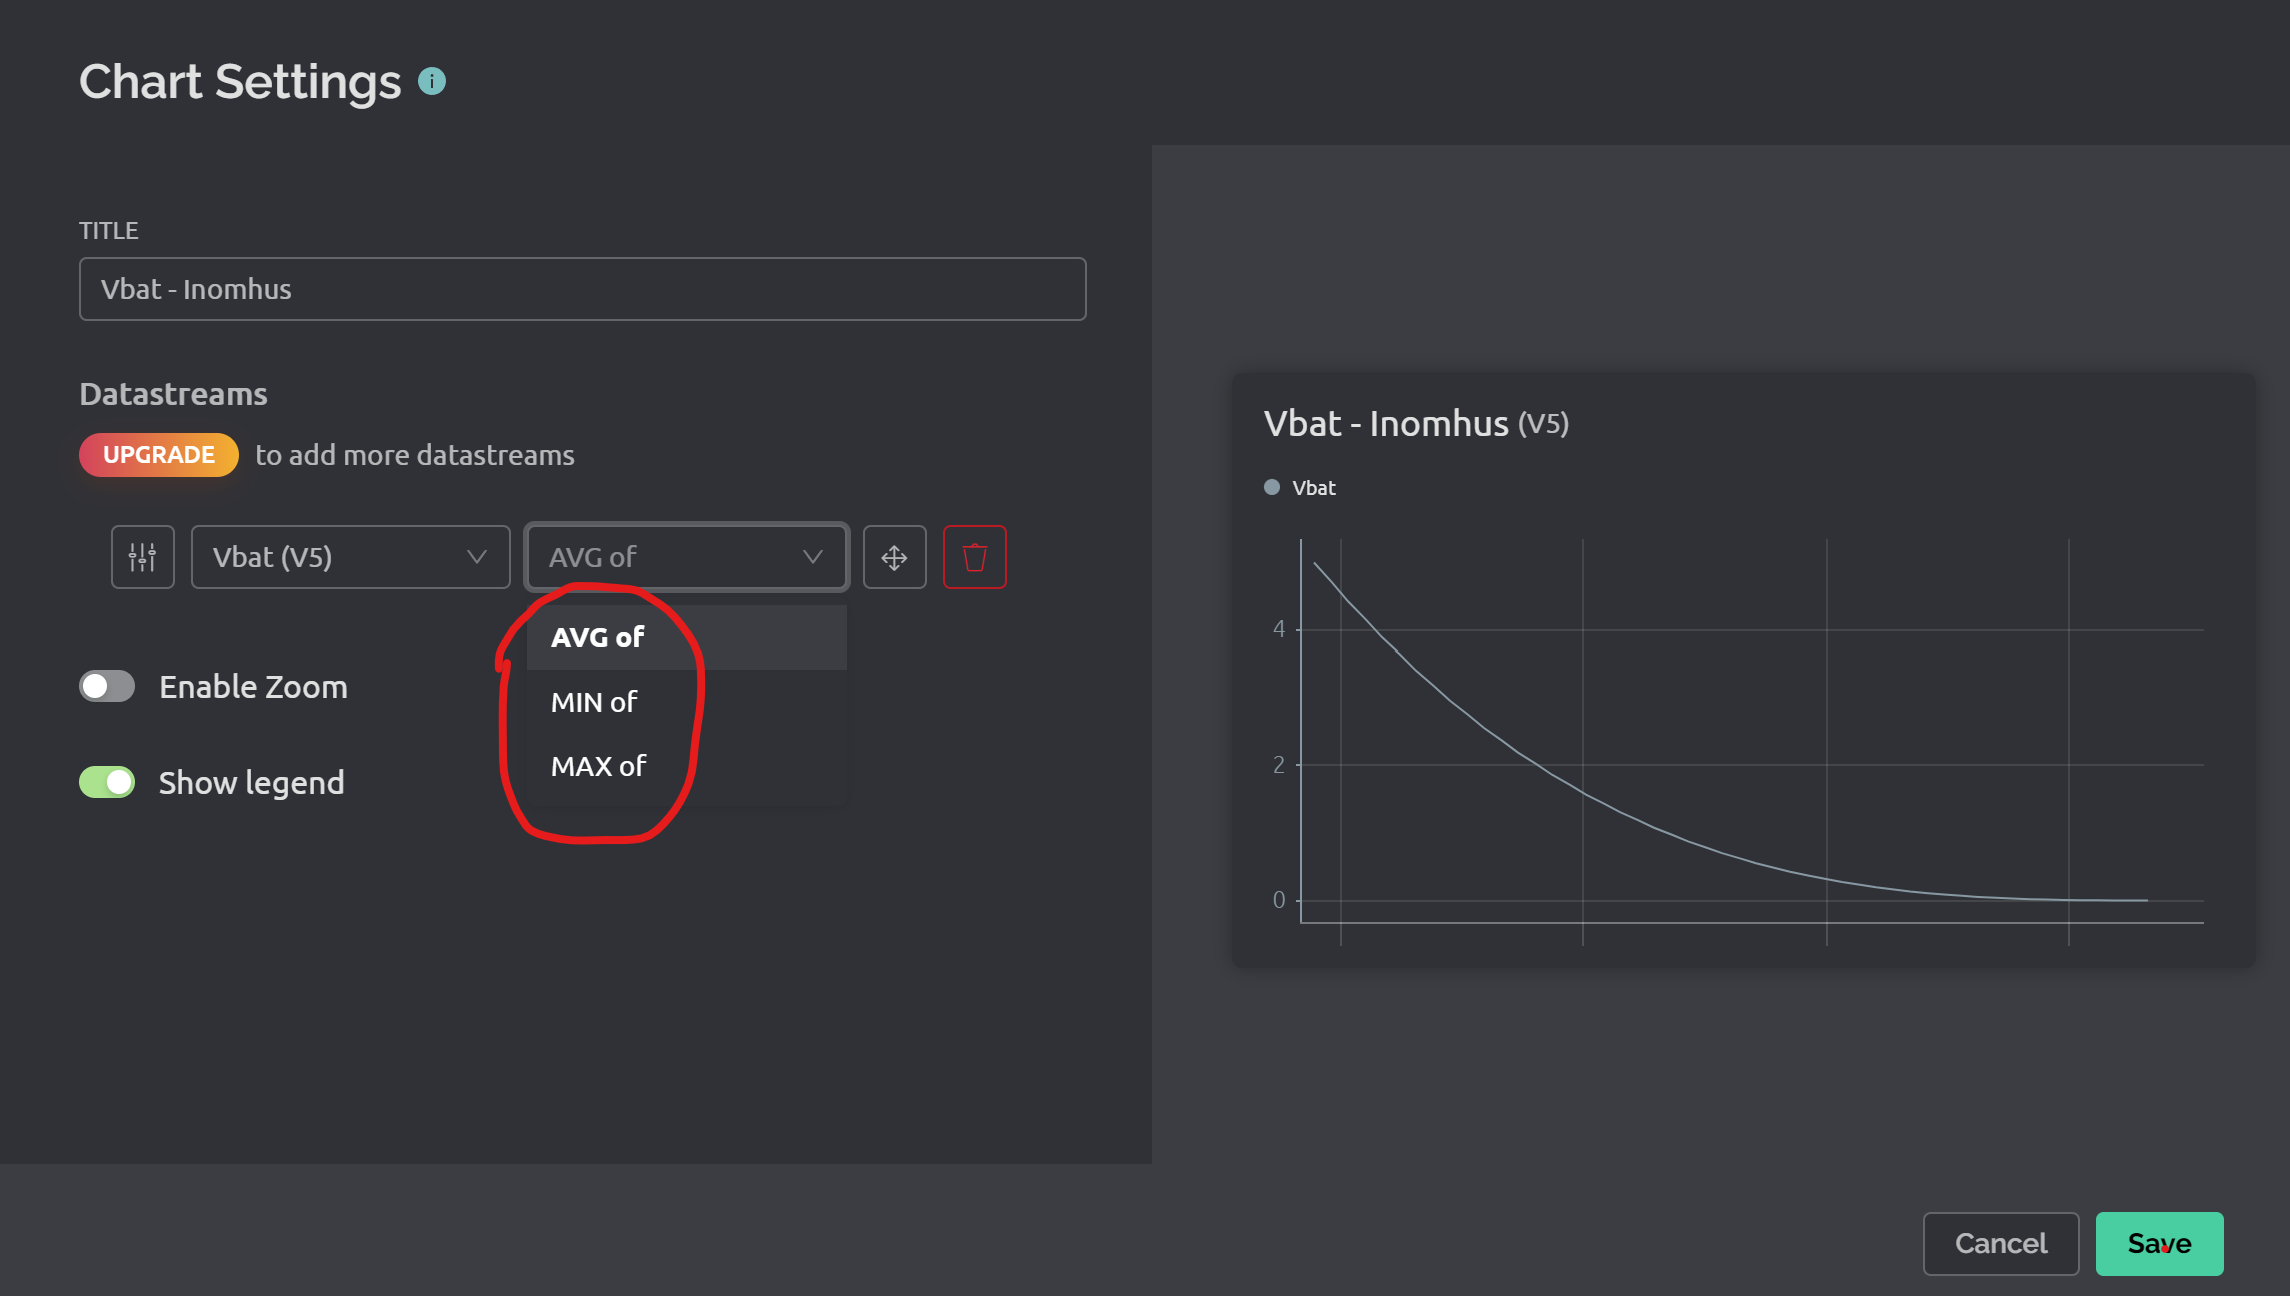
I’m missing the RAW option in the WEB Chart settings. I.e. I can’t configure a chart for anything else than AVG, MIN and MAX. But not RAW (or others).
Problem:
My charts, or graphs rather, in WEB dashboard looks like they don’t display the latest value (if data is changing much) as they show an average and not the actual (raw?) data.
I really would prefer the RAW method as that will show the latest more precise. And you can sooner and better see trend changes.
Anyway, the RAW is not possible to select in chart settings. See images.
Is this a bug or is RAW only valid for other plans, other chart types or maybe for other data types?
In help text (i) you describe this feature but dont say it is only for … plans. I think you really should.
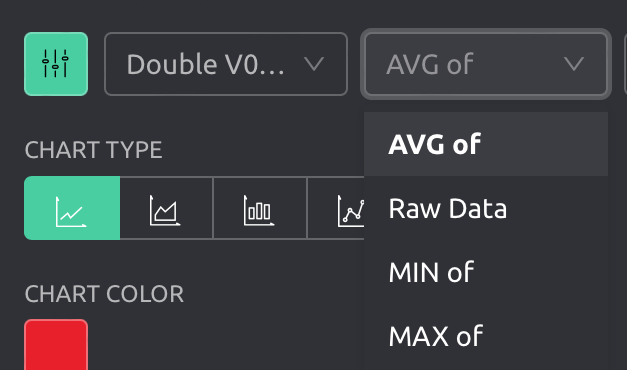
As Pete pointed out it is an option under Advanced settings to enable RAW data. And it has a button “UPGRADE” which clearly tells me I have to upgrade to get this feature. OK.
If I click this button I get to a common page for ALL plans where I can select which to pick, or “upgrade to”.
But which one am I supposed to upgrade to? PLUS or PRO or …
I can’t find this info anywhere.
(This feature in itself is not that important so I would not upgrade for this feature alone. But anyway - you should guide the customer better … )
When I read about the RAW I realize this was not what i wanted. RAW is documented (!) to save data more frequent than once per minute (1/min). (I normally never poll and store data this often anyway …)
That is not what i am after. What i am after is a plot which is not AVG but the ACTUAL value. This is my wish for.
Sometimes, not at all needed. Sometimes wanted for.
To plot the ACTAUL values and not AVG values.
This can lead to “cluttered” graphs, I know. But sometimes you really want the ACTUAL value plotted. I don’t know what other’s feel, but for me - I miss such possibility.
I think that this is how it works, but I may be wrong…
If raw data storage is not turned on, the data received by the database is buffered and stored for 1 minute. Once that minute has elapsed, the data values received are averaged and written to the database.
I believe that this means that there will always be a delay of up to one minute between the data being sent to the Blynk server and it being available to view on the graph, unless raw data is used - but I may be wrong.