can i get data from blynk cloud server and plot it to node-red graphs and gauges ?
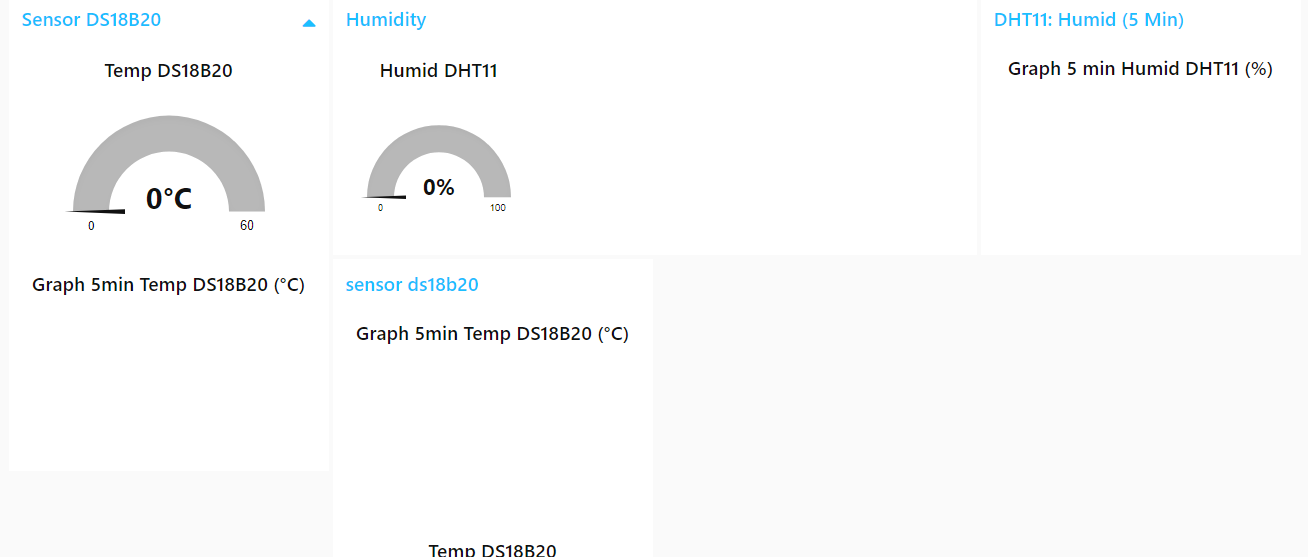
i can’t display nothing:
can i get data from blynk cloud server and plot it to node-red graphs and gauges ?
i can’t display nothing:
whats the wrong in my project,?
and can you explain to me those link you gave me please ?
Thanks!
Im not familiar with nodered. The links I provided just show you that you can retrieve values from the server without the blynk app, using simple http commands.
You’ll have to read up on the nodered user manual yourself to see how you can implement that into nodered.
i got temp value like this [“23.938”]
if anyone could help me how to read just the value in node-red i’ll be thankful
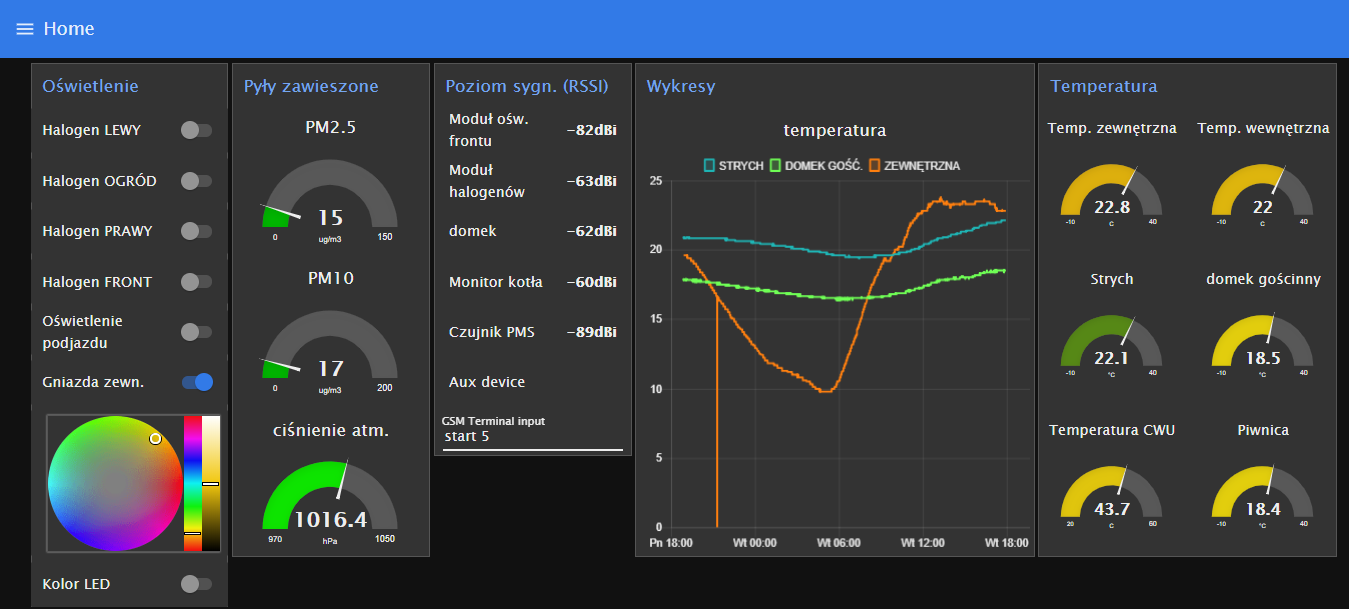
Yes, look at the following graph:
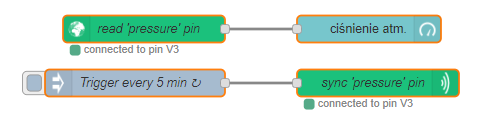
And the triggering node:
And yes, the http API is good for that purpose too. So it is up to you, which way you choose ![]()
the dashboard not displaying anything, even the debug section
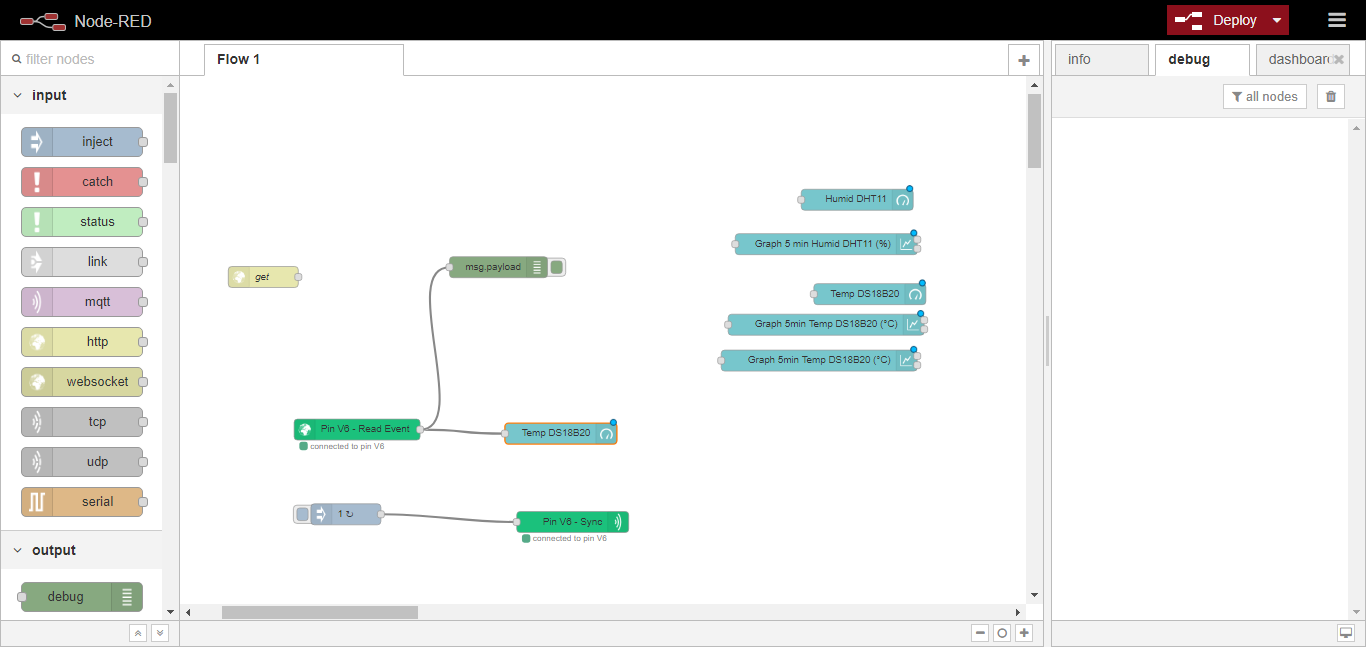
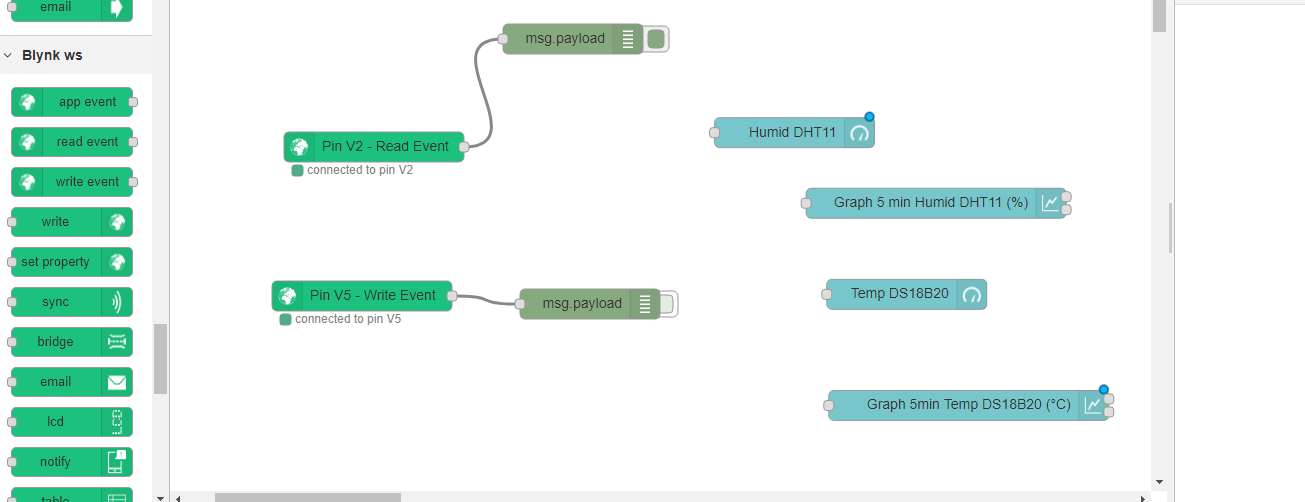
show me your flow
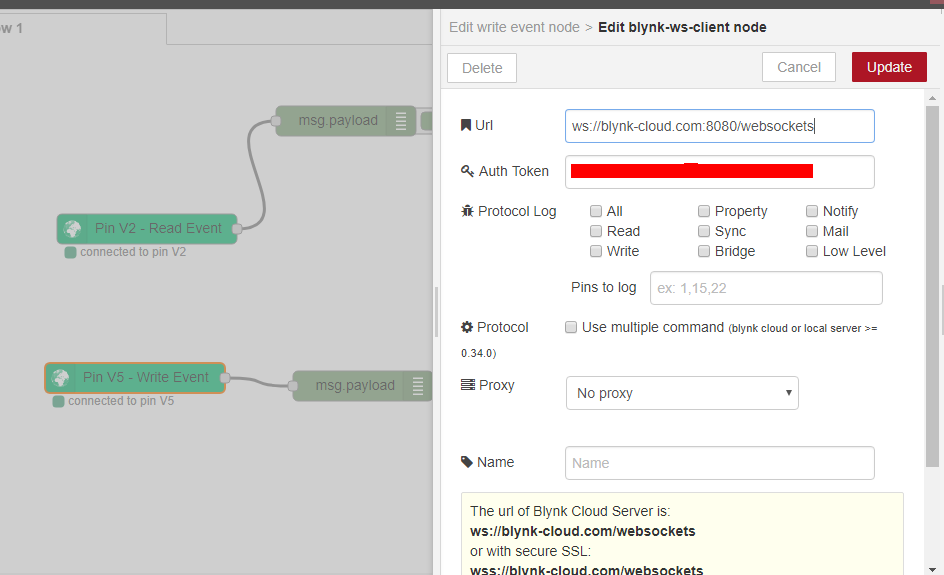
EDIT: And the CLOUD uses port 80 for websockets too!
the code:
[{"id":"59b7ad6.1e7b254","type":"blynk-ws-in-read","z":"a3df79f7.6b1e88","name":"","pin":"6","pin_all":0,"client":"d7d58d72.26873","x":413,"y":508,"wires":[["c3481693.aca6f8","a07694e7.1f83a8"]]},{"id":"d7d58d72.26873","type":"blynk-ws-client","z":"","name":"","path":"ws://blynk-cloud.com/websockets","key":"d6f128e07exxxxxxxxxxxx23","dbg_all":false,"dbg_read":false,"dbg_write":false,"dbg_notify":false,"dbg_mail":false,"dbg_prop":false,"dbg_sync":false,"dbg_bridge":false,"dbg_low":false,"dbg_pins":"","multi_cmd":false,"proxy_type":"no","proxy_url":""}]
Probably there is your problem.
You need to use blynk-ws-in-write node instead.
that make it! 
tanks a lot !!
EDIT: how can i rearrange the dashboard graps and gauges places ?
Glad could help! Remember not to flood the server with too frequent sync’s for multiple pins, as the server might kick you out 
3 pins, is that too much ?
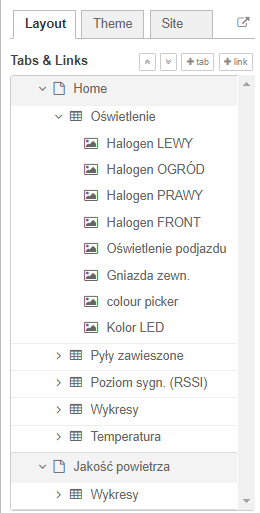
You create pages (the default is there already - in my example it’s ‘HOME’) then groups (for example ‘Oświetlenie’), where you can set the width, and assign dashboard elements to groups (i.e. ‘Halogen lewy’). The element can be drag and drop within a group to arrange it according to requirements.
No, I don’t think so. Just don’t query them every second ![]()
aha okay i’ll do it to 5 minutes haha
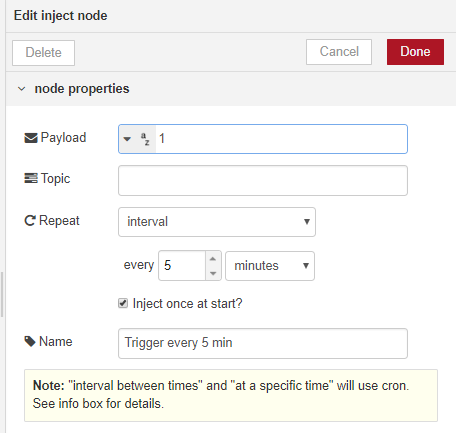
can you give me your inject code ?
![]() How?
How?
import clipboard