Hi everyone.
I’m having a problem to analyse my data that has been exported from History Graph in Blynk.
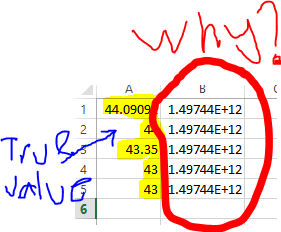
I don’t know, why there are an exponential value beside the true value.
Does anyone know why?
Every help is appreciated.
Thanks.
Hi everyone.
I’m having a problem to analyse my data that has been exported from History Graph in Blynk.
I don’t know, why there are an exponential value beside the true value.
Does anyone know why?
Every help is appreciated.
Thanks.
I believe what you’re seeing is unix time in milliseconds (column A is your data, column B is the time it was recorded). If you click on one of those cells you should see that. You can create a new column dividing that column by 1000, now you have unix time in seconds.
Do a google search… there are some formulas out there for converting Unix time to a standard time/date that you can read as well as adjust for your local time zone.
Updated: LOVE THE CSV EXPORT! Two Things needed, Request From Hardware and Time Range