I want to use Blynk to record temperature from the outdoor station made of esp8266 , using Arduino IDE for the code creation.
I want to use superchart widget.
I wanted to test it first so I created a code that sends sin(x) readings into the superchart .
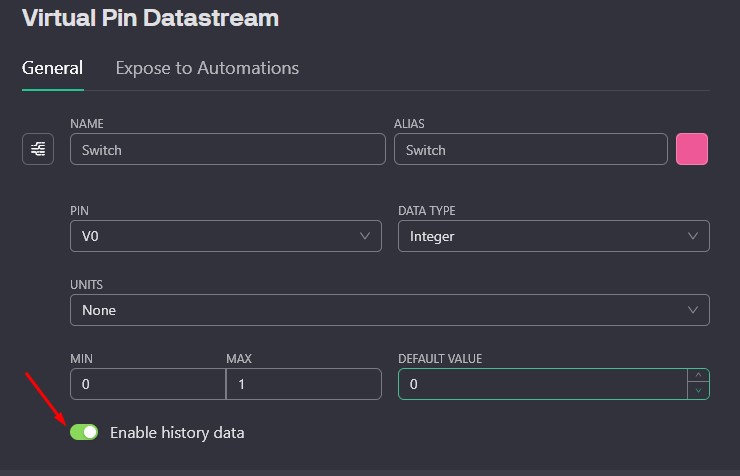
I am using the free plan and I thought there is a possiblility of keeping one week of data. In virtual pin the re is a switch that activates historical data.
However when I connect the blunk app I see the sin(x) function being displayed up to a point and then after 20+ readings There is a glitch and the sin(x) gets drawn from the start. If I close the blunk app and reopen it I do not see data that was transfered to the virtual pin when the blynk app was closed.
Is it possible to store history and have it displayed o n the chart each time I open the blunk up for the whole perion arduino sketch was started.
#define BLYNK_TEMPLATE_ID "TMPL4dzCelDj6"
#define BLYNK_TEMPLATE_NAME "BlynkChart"
#define BLYNK_AUTH_TOKEN "UD9b3PXwKRy6WmKkDKvSN4UTrcjoNzCI"

#include <ESP8266WiFi.h>
#include <BlynkSimpleEsp8266.h>

#include <math.h>

char ssid[] = "Dziubym";
char pass[] = "Mikigosia1";

BlynkTimer timer;  // Timer to send data periodically

float angle = 0;  // Angle in radians

void sendSinToBlynk() {
  float value = sin(angle);
  Blynk.virtualWrite(V0, value);  // Send value to V0
  Serial.println(value);
  angle += 0.1;  // Increment angle
  if (angle >= 2 * PI) {
    angle = 0;
  }
}

void setup() {
  Serial.begin(9600);
  Blynk.begin(BLYNK_AUTH_TOKEN, ssid, pass);

  // Set up the timer to send sine value every 100ms
  timer.setInterval(1000L, sendSinToBlynk);
}

void loop() {
  Blynk.run();
  timer.run();  // Needed to run the timer
}