It seems when a new datastream value is sent i.e. 0 to 1 for a Led widget I do not see this new value immediately on the dashboard, I first need to switch tabs and then the new value becomes visible.
This problem does not occur in edge, there the new value is immediately shown
(I did recently update chrome…)
Anyone else has the same issue?
And maybe a fix? Is this a setting in chrome
Chrome: Version 106.0.5249.119 (Officiële build) (64-bits)
Edge version: Version 106.0.1370.52 (Official build) (64-bit)
Hello,
I reproduced this situation with Led widget. Use Chrome: Version 106.0.5249.119 (Official build) (64-bits). Use datastream (virtual pin, type integer, min 0, max 0 value) in Led widget. Update value by Postman (Get metod, REST API) Update Datastream Value - Blynk Documentation. Values change.
Please explain how you updated the values and what datastream you are using.
Regards
thx for looking into this.
We update the values of virtual pins (i.e. VP80) from an esp32 via LTE:

It does arrive in Blynk as I did see the value being updated in an edge browser (I ran both chrome and edge looking at the same dashboard simultaneously)
I just checked again and strangely enough it is working again and I am not able to reproduce the same behavior in chrome anymore. 
Any idea what could have caused this? What should I check for troubleshooting purposes if it happens again?
Perhaps the problem is related to the browser update.
just had the same issue, closing and reopening the tab in chrome does not resolve it.
Restarting chrome resolves it. (edit: only for a short while)
(I do always keep my browser open and hibernate my system, I almost never fully boot it)
just noticed a big difference.
In edge I get redirected to fra1.blynk.cloud
In chrome it remains blynk.cloud
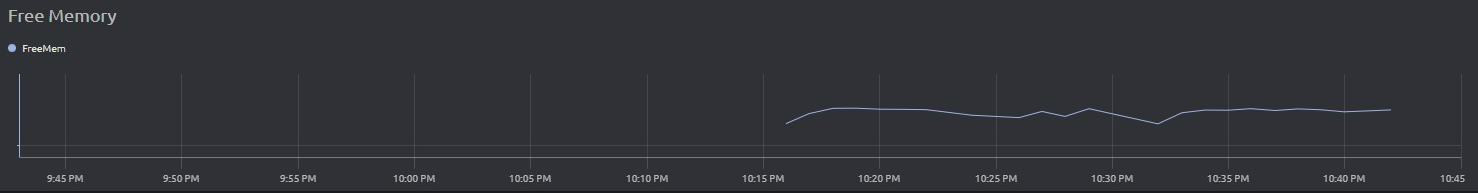
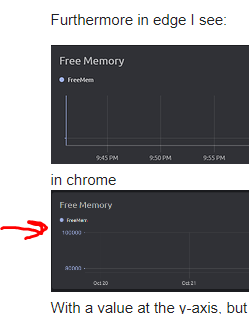
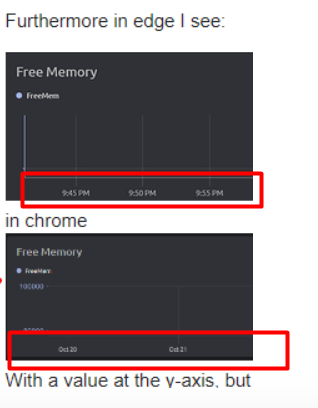
Furthermore in edge I see:
in chrome
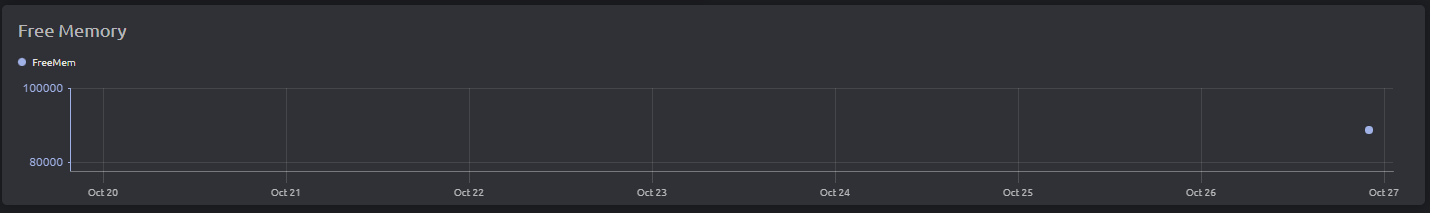
With a value at the y-axis, but not updating, only one value:
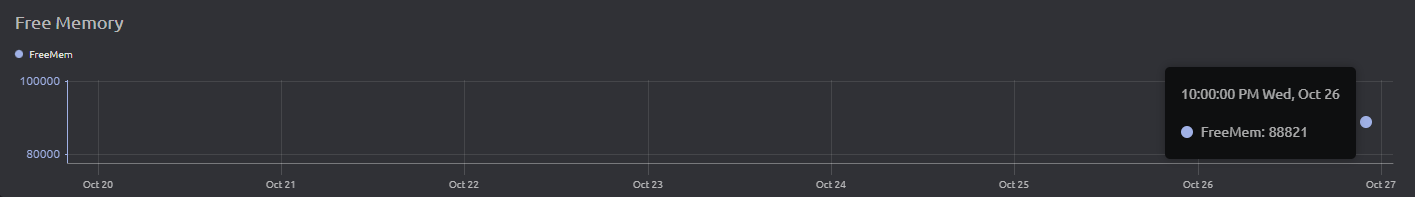
And after some time, a second value was added (exactly on the hour again…??)
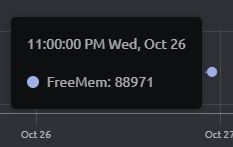
But the datastream shows a different last value:
If I change it in chrome to fra1.blynk.cloud I am not seeing the value at the y-axis anymore:
And to make it completely confusing,
my colleague is seeing this in chrome (both on blynk.cloud as on fra1.blynk.cloud):
so no values at the y-axis
Both him and me are on Version 107.0.5304.63 (Officiële build) (64-bits)
Hello,
Our QA team reproduced this situation in the Google Chrome 107.0.5304.63 (64 bit). Used Chart widget with different sensors (temperature, humidity). Everything works correctly.
You may have a problem with your browser settings. Try clearing your history and cookies.
Try again to revise the Chart widget settings. Perhaps it will be useful for you this docs Widgets (Console) - Blynk Documentation
Chart - Blynk Documentation
Regards
And Graph is updated in realtime only under “Latest” period selection.
thx for following up. I will try the history and cookies.
So there is no difference between fra1.blynk.cloud and blynk.cloud?
And does your quality team also have a value at the y-axis of the graph widget?
These images are from the same dashboard so it cannot be widget settings I guess.
I am interested how this can differ based on browser or logged in user as my colleague does not see the values either.
Hi Jeroen,
The screenshots show that you are using a different time period -
please use the same time period for comparison.
Regards
Hi Dimitry
Sorry to keep going on about this topic but I just want to understand what is happening so that I can give clear instructions to my customers…
You say use the same time period, but It is the exact same dashboard and the same widget?
I see y-axis values now in both browsers on both URL’s, maybe it is related to the amount of values in the widget
Why do I have differences in amount of values on the different url’s? Below a screenshot of the two different url’s in seperate browser windows:
(I stroke out part of the url as I am not sure it is public data, but those pieces are exactly the same…)
The top one has lesser values, it only has hourly values (exactly on the hour as said before)
You seem to have the Time Range Selector hidden for your web dashboard, although it’s a bit difficult to tell from your screenshots and there does appear to be a scroll bar at the right had side of one of them.
Your top image shows the dates from 21st to 28th October, so it’s in “1 Week” view.
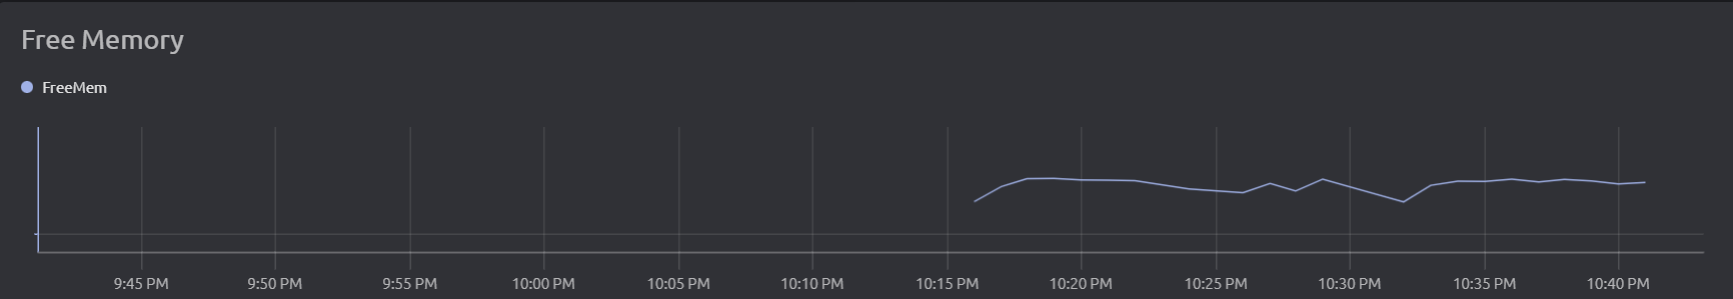
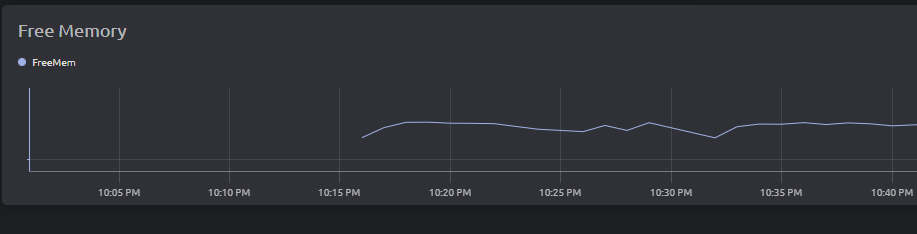
The lower image shows 9:40pm to 9:35pm, so it’s in “Last Hour” view.
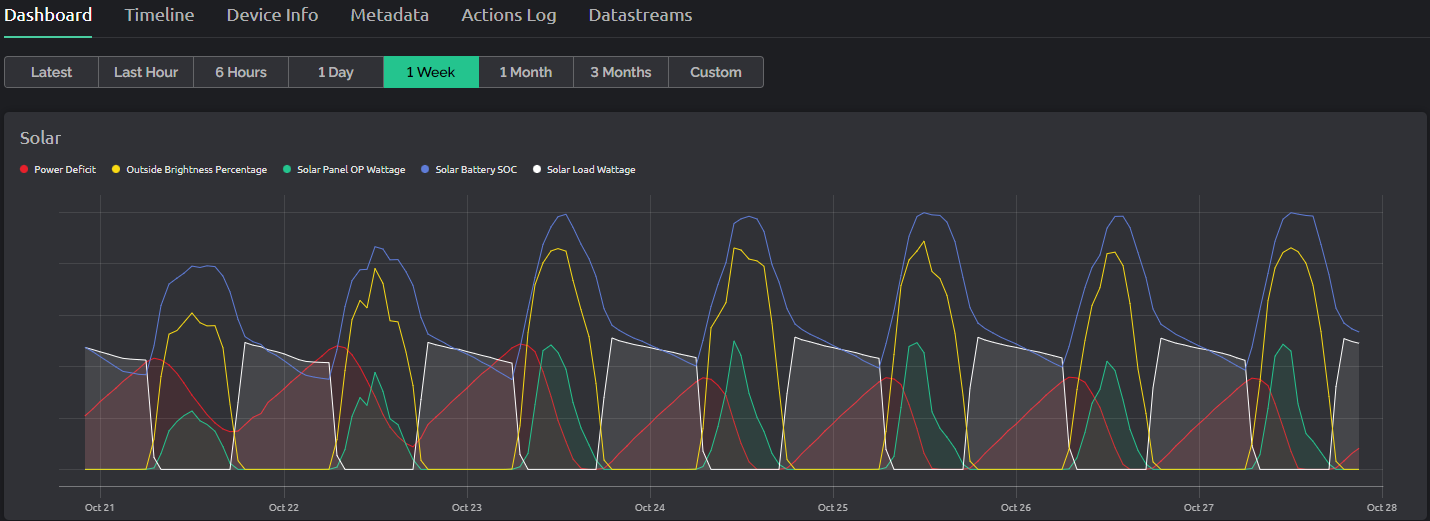
Here’s what Last Hour:
and 1 Week:
look like for the same chart on one of my dashboards - both under Chrome.
If you can’t see the Time Range Selector then go to the template view and edit mode then you’ll see the greyed-out selector. When you hover your mouse over it you’ll see a switch to turn it on…

@DimitryPB would like to see your browser comparisons with the chart set to show the same time range in both browsers, so that there is a direct like-for-like comparison.
Pete.
ah, indeed I had the time range selector hidden.
Showing it indeed shows a difference depending on which url I open
Setting them both equal indeed shows the same view and values (probably averaged) updated on the hour (in week view)
So this difference is clear, the different period view in url is maybe due to cookies…
Thx Pete, this helps clarifying.
So back to the drawing board for my original issue (values not updating)