Hi,
can somebody please point me to the custom chart documentation ?
I can’t figure out on how it works, since there are no settings for the datastreams
thanks a lot !
Bruno
Hi,
can somebody please point me to the custom chart documentation ?
You chose the datastreams from the Device view, not the Template view.
Pete.
Hello,
Custom chart documentation will be published soon. And you can reed Service - Blynk Documentation
But I can provide you some doc about custom chart
Available to PRO plan
The Custom Chart widget is a chart that is fully configurable by your users. You add the widget to your template web dashboard, and then you or your users may customize it from the Search → Device console. The datastream(s) must already exist prior to customizing the chart.
From Templates → Web Dashboard, select or create a tab. Then drag and drop the Custom Chart widget to the tab’s window. Click the ‘Save And Apply’ button at the upper right when finished.
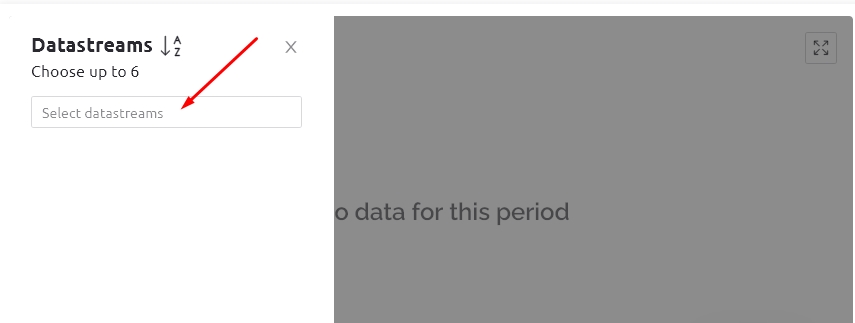
Datastreams - Select an existing datastream of any data type (integer, double, string, enumerable, GPS) to be displayed in the Custom Chart widget.
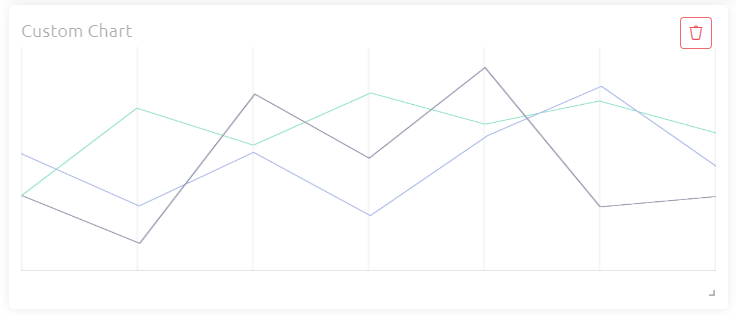
The slider below the chart will adjust the time period displayed. Note that the Time Period Filter above the chart has no effect on the time period displayed.
[add GIF that shows assignment of two or more datastreams to the Custom Chart, followed by displaying data in the chart and using the slider below the chart to change the time period displayed]
Only one servise chart can be added ad this time
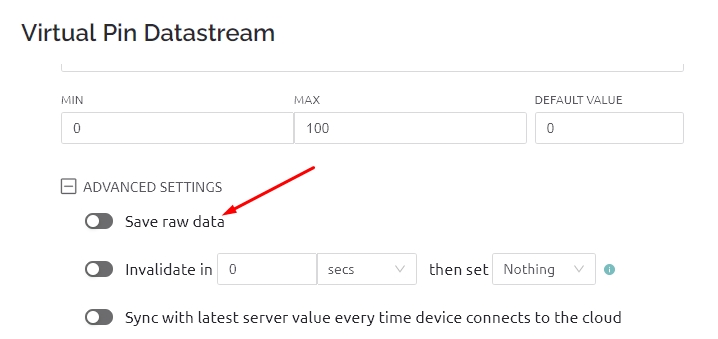
And you can add datastream to custom chart in device dashboard. And working with datastream with “Save raw data” turn on switch
Hi Pete,
as you can see I was in the template editor since there is the trash icon
Edit : ok you are right I did not read Oleksii’s answer before answering you
Thank you Oleksii, it is a nice feature, very eager to try it
Regards,
Bruno