Hello,
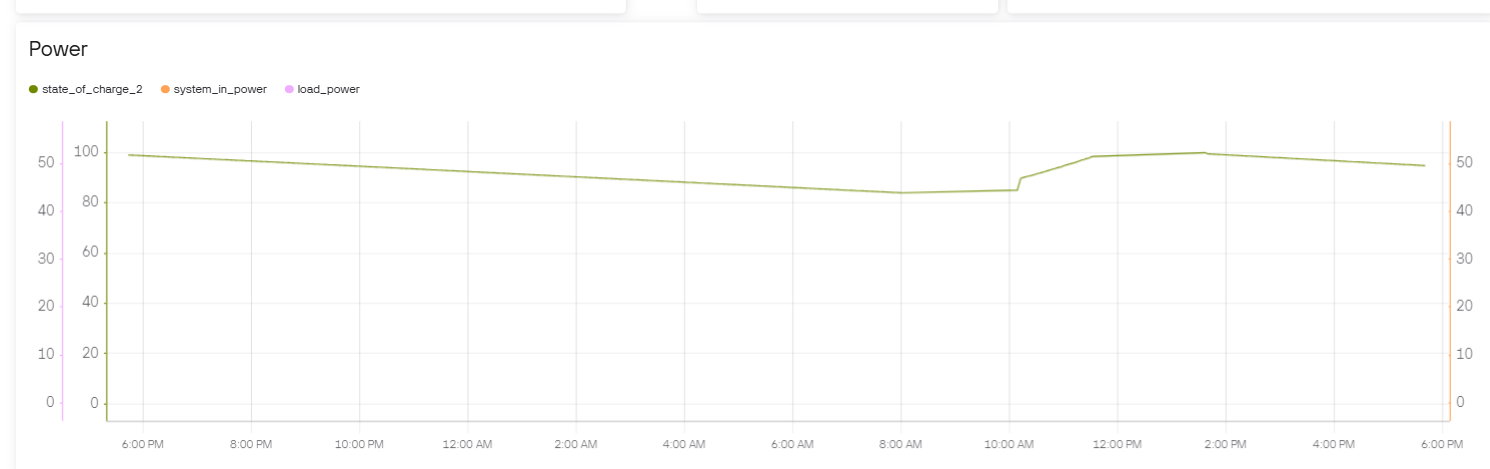
I am using the web dashboard (NY3), Chrome (155.0.8059.39), and getting data through notehub.io. I created several charts with 3 multiple datastreams, but the chart only ever plots the first
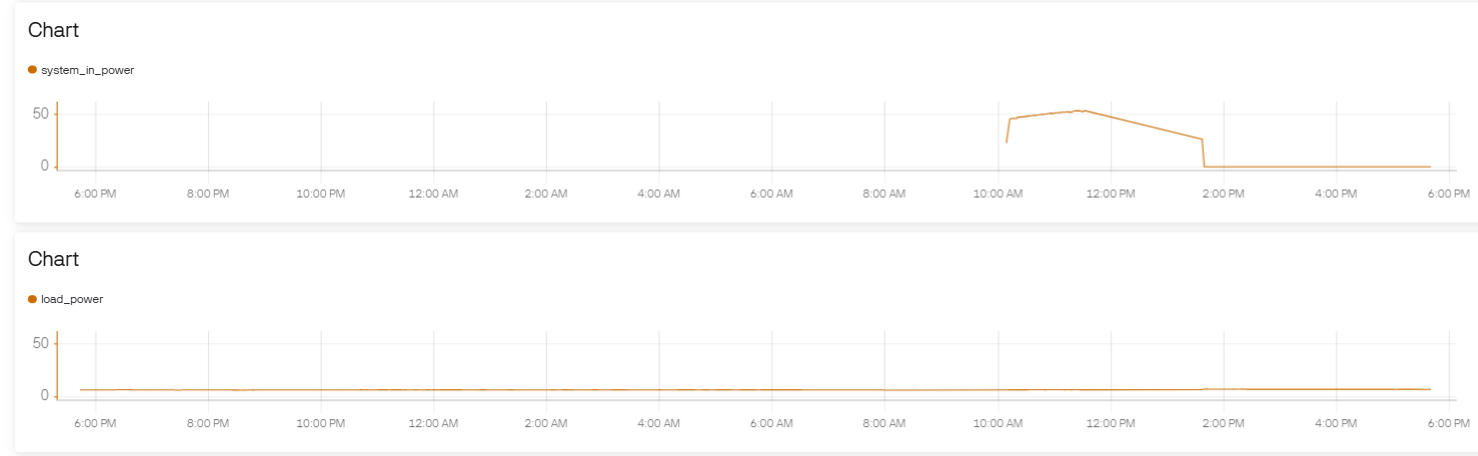
To show there is data from the other datastreams, I created individual charts of each datastream, and they plot. Unfortunately I can’t upload more that one photo as someone new…
If I click on the datastream name in the label to turn it off in the chart, the chart just shows no data, even though the two other datastreams are still enabled.