Blynk team created a great widget we can use it to visualize the Data which is Superchart
we can attach many Virtual pins to generate a charts which is very helpful.
also we can export the data in "CSV" format , buy clicking the three dots under the superchart widget and select "export to CSV" you will receive and email from Blynk to your registered email address
in the email you will find attached CSV file for all the Vpins in your superchart
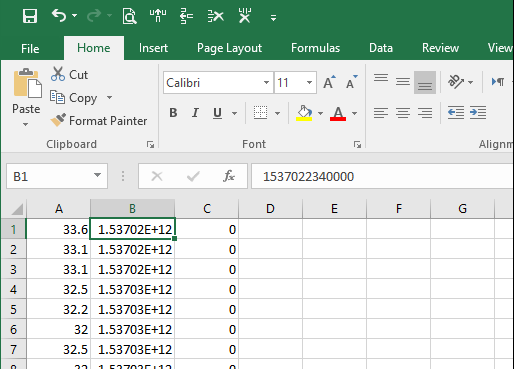
when opining it using MS excel you will find it as below
the Data is saved in we will find it in Unix timestamp format which is 10 digits represent the total number of seconds since midnight (GMT time) on January 1, 1970
So how can we convert it to a readable Date and time in MS excel
Below is the exact data we found after export without any edit we can see in Cell “B1” the value
“1537022340000” of timestamp which is 13 Digit but we need to use the first 10 digits only from the left
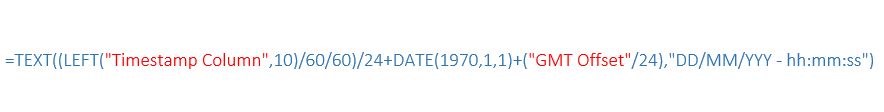
You can add the below formula in cell D1
if you will use it in any other similar conversion you can replace the"Timestamp Column" with your exported data , and "GMT Offset" with the number of hours from GMT to your local time zone , for example yourtime zone is +3 GMT use +(3/24) , if it is -1 GMT use -(1/24)
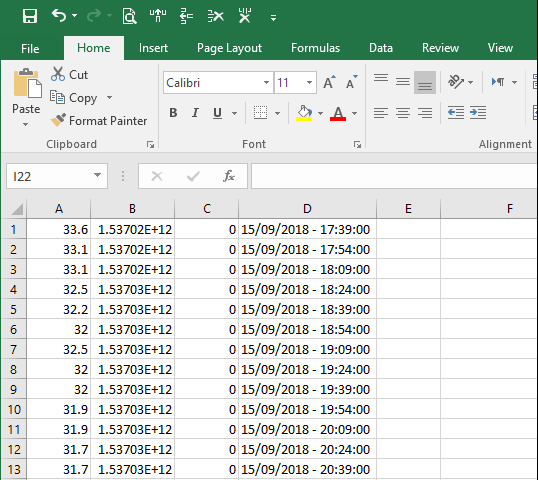
if you drag the formula to the reset of the rows you will get a similar result to below image
i hope this will be helpful to some of Blynkers here
not before you asked , as i can see it has alot of option and that is great thing.
but i noticed the energy required is zero to set up , but when i run the project it shows that it will cost 2,900 energy
is this is per report run or one time payment ? is it recoverable when widget deleted ?
i will take detailed look into this widget later , thanks @Dmytro for the continuous great work
Thank you for the explanation of the timestamp format in the Blynk data and how to convert it into the Excel date value text. However, it’s better practice in Excel to use the internal timetime value rather than the converted text as in the example. So, I would use the formula
This converts the UnixDateText to the Excel datetime value (the floating number of days since 1/1/1900).
Then you can use a custom cell format like “YYYY-MM-DD HH:MM:SS” to display the number as a date/time value even though the date value is stored in the cell. This way, when you plot data in an x-y scatter chart as function of time, the axis will show the dates. If the time column is text, Excel will ignore it and plot the data as a simple line chart with the index value along the x-axis.
Hi, the 3 dots that were previously used in Blynk to generate the report are now missing in the new Blynk 2.0, do you by any chance know of another method of generating the excel sheet of data?