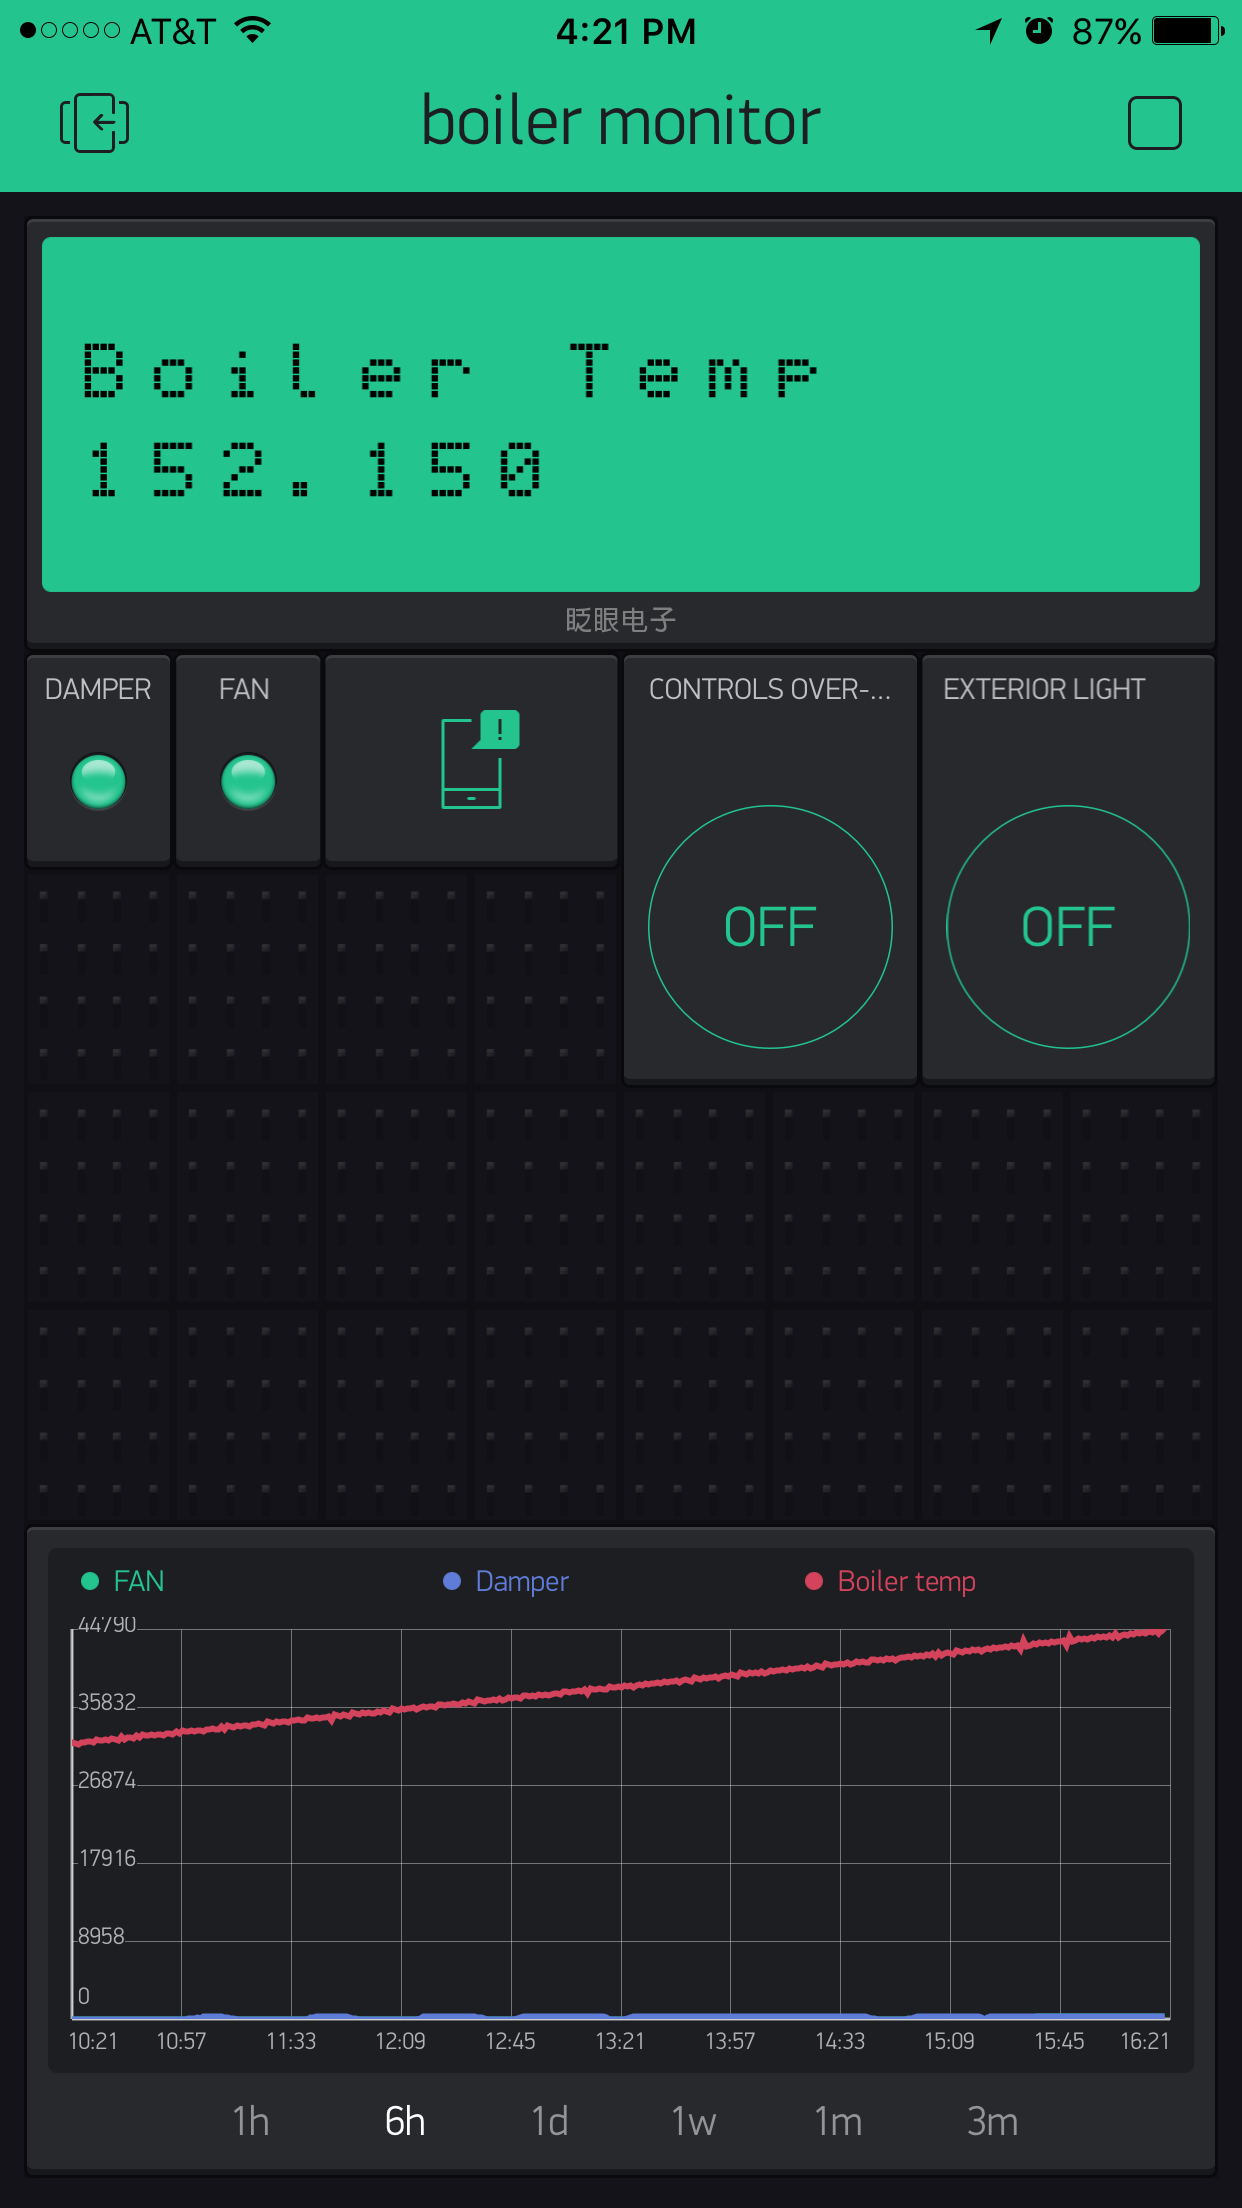
I am using an Arduino uno with a Ethernet shield, DS18B20 temp sensor along with this incredible Blynk app to monitor my outdoor wood boiler. I originally had a issue with cycling a relay to turn the exterior light on with a Button widget because i did not use the Simple timer function to control the frequency of a Blynk.virtualWrite(). This solved my issue but has caused another and now I am stuck. Before I was using Blynk.virtualWrite() with the history graph to graph the boiler temperature and it was graphing beautifully until I deployed the SimpleTimer function to correct my flooding issue. I am also graphing when the fan and damper is open or closed. Now when I try to graph the boiler temperature the temperature appears to be way out of line and steadily increasing but the readout on the LCD is correct???
I was wondering if someone would be able to take a look at my code to see if anything stood out as to where my issue may be.
Photo without V7 selected on history graph;
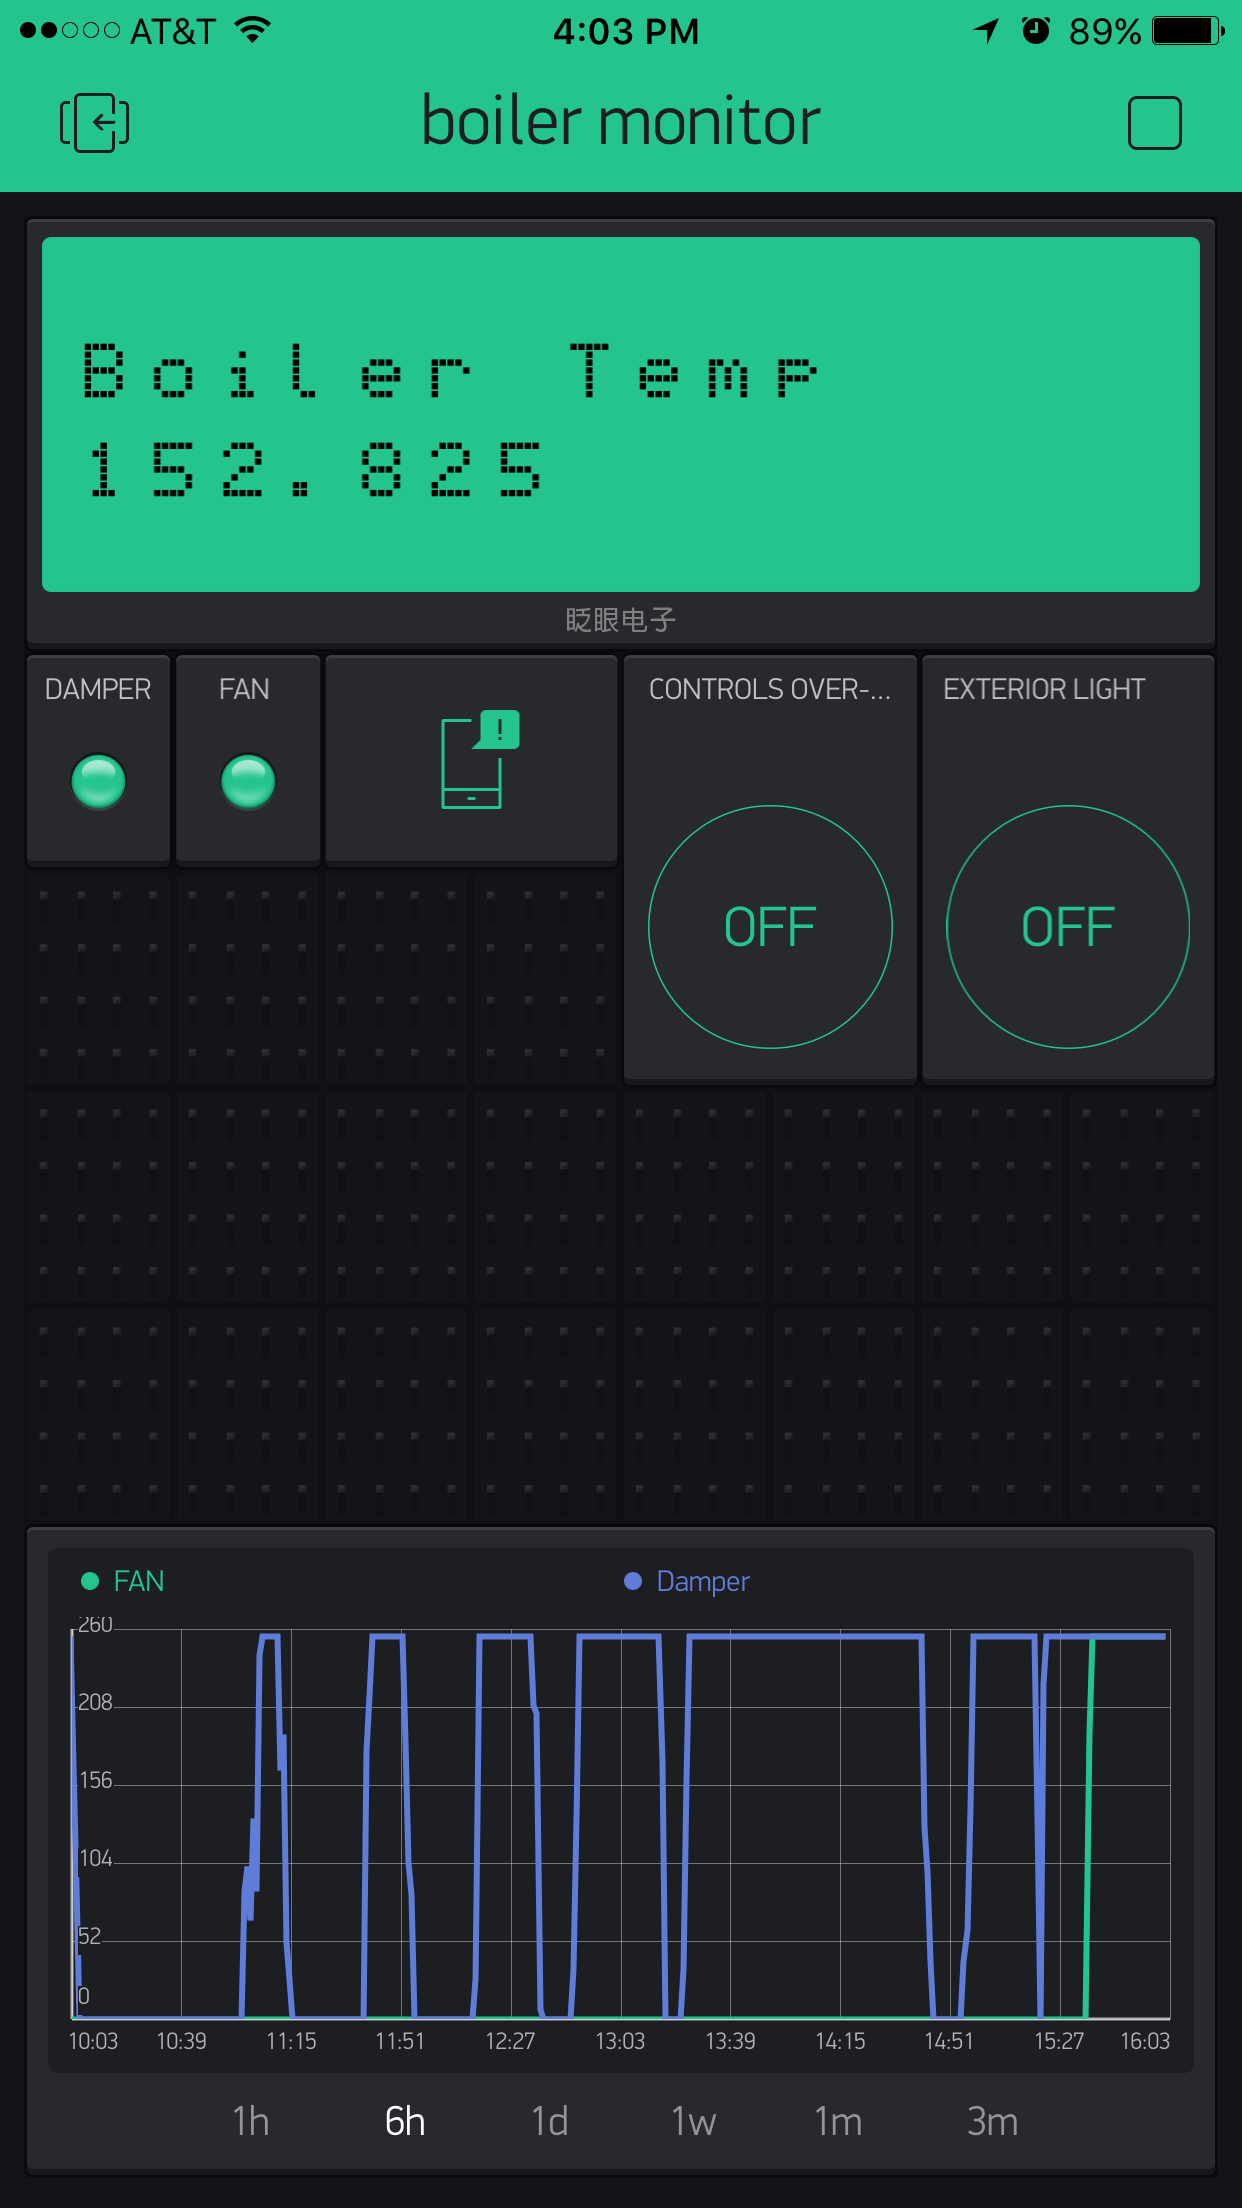
Photo with V7 selected.
Here is the code… I know its ugly…
  // Wiring Guide
  // Fan switch- wire from 5V through  fan suction switch to Pin 3
  // DS18b20 wiring - Red wire goes to 5V, Black Wire goes to Ground, White Wire goes to pin 7
  // Thermistor for outside temp- 5v to one side of thermistor other side of thermistor with  10K OHMS risistor to A0
  //   other side of risistor to ground http://www.circuitbasics.com/arduino-thermistor-temperature-sensor-tutorial/
  // RELAY1  wire to pin 5
  // RELAY2  wire to pin 9
  // RELAY3  wire to pin 2
  // Temp Sensor A0 white wire- Red 5v - Black Ground


#define BLYNK_PRINT Serial // Enables Serial Monitor
#include <SPI.h>
#include <Ethernet.h>
#include <BlynkSimpleEthernet.h> // This part is for Ethernet stuff
#include <OneWire.h>
#include <SimpleTimer.h>
const int buttonPin1 = 3;
WidgetLED led3(V3);
const int buttonPin2 = 4;
WidgetLED led4(V4);
WidgetLCD lcd(V1);

SimpleTimer timer;


OneWire  ds(7);  // on pin 10 (a 4.7K resistor is necessary)
int buttonState = 0;

char auth[] = "xxxxxxxxxxxxxxxxxxxxxx"; // Put your Auth Token here. (see Step 3 above)

  #define RELAY1  5
  #define RELAY2  9
  #define RELAY3  2

void setup()
{
  Serial.begin(9600); // See the connection status in Serial Monitor
  Blynk.begin(auth);  // Here your Arduino connects to the Blynk Cloud.
  pinMode(RELAY1, OUTPUT);
  pinMode(RELAY2, OUTPUT);
  pinMode(RELAY3, OUTPUT);
  digitalWrite(RELAY1, HIGH);
  digitalWrite(RELAY2, HIGH);
  digitalWrite(RELAY3, HIGH);
  pinMode(buttonPin1, INPUT);
  pinMode(buttonPin2, INPUT);
  timer.setInterval(1000L, sendUptime);

}

void sendUptime()
{
   Blynk.virtualWrite(V7, millis() / 1000);
}

void loop()
{
  Blynk.run(); // All the Blynk Magic happens here...
  timer.run();


  // You can inject your own code or combine it with other sketches.
  // Check other examples on how to communicate with Blynk. Remember
  // to avoid delay() function!


  delay(100);
  byte i;
  byte present = 0;
  byte type_s;
  byte data[12];
  byte addr[8];
  float celsius, fahrenheit;

  if ( !ds.search(addr)) {
    Serial.println("No more addresses.");
    Serial.println();
    ds.reset_search();
    delay(250);
    return;
  }

  Serial.print("ROM =");
  for ( i = 0; i < 8; i++) {
    Serial.write(' ');
    Serial.print(addr[i], HEX);
  }

  if (OneWire::crc8(addr, 7) != addr[7]) {
    Serial.println("CRC is not valid!");
    return;
  }
  Serial.println();

  // the first ROM byte indicates which chip
  switch (addr[0]) {
    case 0x10:
      Serial.println("  Chip = DS18S20");  // or old DS1820
      type_s = 1;
      break;
    case 0x28:
      Serial.println("  Chip = DS18B20");
      type_s = 0;
      break;
    case 0x22:
      Serial.println("  Chip = DS1822");
      type_s = 0;
      break;
    default:
      Serial.println("Device is not a DS18x20 family device.");
      return;
  }

  ds.reset();
  ds.select(addr);
  ds.write(0x44, 1);        // start conversion, with parasite power on at the end

  delay(1000);     // maybe 750ms is enough, maybe not
  // we might do a ds.depower() here, but the reset will take care of it.

  present = ds.reset();
  ds.select(addr);
  ds.write(0xBE);         // Read Scratchpad

  Serial.print("  Data = ");
  Serial.print(present, HEX);
  Serial.print(" ");
  for ( i = 0; i < 9; i++) {           // we need 9 bytes
     data[i] = ds.read();
    Serial.print(data[i], HEX);
    Serial.print(" ");
  }
  Serial.print(" CRC=");
  Serial.print(OneWire::crc8(data, 8), HEX);
  Serial.println();

  // Convert the data to actual temperature
  // because the result is a 16 bit signed integer, it should
  // be stored to an "int16_t" type, which is always 16 bits
  // even when compiled on a 32 bit processor.
  int16_t raw = (data[1] << 8) | data[0];
  if (type_s) {
    raw = raw << 3; // 9 bit resolution default
    if (data[7] == 0x10) {
      // "count remain" gives full 12 bit resolution
      raw = (raw & 0xFFF0) + 12 - data[6];
    }
  } else {
    byte cfg = (data[4] & 0x60);
    // at lower res, the low bits are undefined, so let's zero them
    if (cfg == 0x00) raw = raw & ~7;  // 9 bit resolution, 93.75 ms
    else if (cfg == 0x20) raw = raw & ~3; // 10 bit res, 187.5 ms
    else if (cfg == 0x40) raw = raw & ~1; // 11 bit res, 375 ms
    //// default is 12 bit resolution, 750 ms conversion time
  }
  celsius = (float)raw / 16.0;
  fahrenheit = celsius * 1.8 + 32.0;
  Serial.print("  Temperature = ");
  Serial.print(celsius);
  Serial.print(" Celsius, ");
  Serial.print(fahrenheit);
  Serial.println(" Fahrenheit");


  Blynk.virtualWrite(V7, fahrenheit);
  lcd.clear();
  lcd.print(0, 0, "Boiler Temp");
  lcd.print(0, 1, fahrenheit);

  if ( fahrenheit>=180){
    Blynk.notify("Boiler Temp High!");
  }

 buttonState = digitalRead(buttonPin1);
  if (buttonState == LOW) {
    // turn LED on:
    led3.on();
  } else {
    // turn LED off:
    led3.off();
  }
  buttonState = digitalRead(buttonPin2);
  if (buttonState == LOW) {
    // turn LED on:
    led4.on();
  } else {
    // turn LED off:
    led4.off();
  }
  }

  BLYNK_WRITE(5)
{
   int i=param.asInt();
   if (i==1)
   {
     digitalWrite (RELAY1,LOW);
   }
   else if ((i==0))
   {
     digitalWrite(RELAY1,HIGH);
   }

}
 BLYNK_WRITE(9)
{
   int i=param.asInt();
   if (i==1)
   {
     digitalWrite (RELAY2,LOW);
   }
   else if ((i==0))
   {
     digitalWrite(RELAY2,HIGH);
   }
}

   BLYNK_WRITE(2)
{
   int i=param.asInt();
   if (i==1)
   {
     digitalWrite (RELAY3,LOW);
   }
   else if ((i==0))
   {
     digitalWrite(RELAY3,HIGH);
   }
}