Superchart works with Live but not other time intervals

Hi,
I am running…
Blynk version 2.22.0 (5) on an iPhone X, iOS 11.4.1
I am sending four temperature data streams to my Blynk project.
All the temperatures show up in their value displays without any problem. They are updated every 1-2 seconds.
I want to display the same temperatures in a superchart too. The superchart seems to work as expected when I choose “Live”, but if I switch to any other time interval (e.g. 15m or 1h), I only see “No data yet…” in the chart.

I don’t know if this is relevant, but two of the temperature values are integers, two of the temperatures are float.

I am quite sure I had the superchart working a few months ago. My code on the device side has not changed since then. I am using an Arduino Mega2560 connected to an ESP-WROOM-02U, and I am sending to the Blynk server… not a local server.

One thing that has changed in the last few months is that I am now using my Blynk project to connect to many devices, so now I use the “Choose Unit” for the source of each data stream.

I tried just one data stream in the superchart… same problem: The chart works in “live” mode but no other time intervals where I see “No data yet” in the chart. I also tried changing away from “Choose Unit”… and I specified the specific unit for the data stream… same problem.
Hello, most probably you are sending not a number but string with some spaces or something like that. Please check values you send.

My code is using variables for the temperatures, two are declared as integers, two as float. So I cannot imagine any way for them to be changed to string with extra characters.
Update…
The superchart started working, and then it got flaky and stopped working.
To get it working, I think it helped when I deleted three of the four data streams from the chart. Then I could see data in other time intervals.
Thinking that the problem had gone away, I started adding back the data streams to the chart one by one. But then the chart got flakey and it would not show new data… only random data from the past… for example now the chart is only showing data from 10:50 to 12:05, and my watch is now at 12:19. There is no data in the chart from 12:05 to 12:19.
The chart seems to always work in “live” mode, but not always with other time intervals.
The value fields in the project are showing the data streams with no problem, so I don’t think there is any issue with the way the data is formatted and sent from my Arduino.

Please show the code.

Also do you use Cloud or local?
What is your setup with “working” graph and what is with non-working?

I am using the cloud.
My code is about 2000 lines, so I will trim it down to show my variable declarations and the subroutine where I send info to Blynk.

//Declaring variables
int16_t topSensorTemp = 0;        
int16_t bottomSensorTemp = 0; 
float coldSideTemp = 11.1;   
int targetTemp = -30;   
float ambientTemp = 33.3; 
uint8_t activeCryoPower = 100;      
uint8_t maxCryoPower = 100;         


// lots and lots of code 


void UPDATE_BLYNK_3SEC(){
if(wifiUp){
    Blynk.virtualWrite(V0, topSensorTemp);
    Blynk.virtualWrite(V1, bottomSensorTemp);
    Blynk.virtualWrite(V3, coldSideTemp);
    if(cryoSwitchState == 1 || motorSwitchState == 3){  
      Blynk.virtualWrite(V2, targetTemp);               
    }                                                   
    else{
      Blynk.virtualWrite(V2, -88);
    }
    Blynk.virtualWrite(V4, ambientTemp); 
    if(cryoSwitchState == 1 && runSwitch == false){Blynk.virtualWrite(V6, maxCryoPower);}  
    if(cryoSwitchState == 1 && runSwitch == true){Blynk.virtualWrite(V6, activeCryoPower);}
    if(cryoSwitchState != 1){Blynk.virtualWrite(V6, 100);}
  }
}

The data I want in the superchart is ambientTemp, topSensorTemp, bottomSensorTemp and coldSideTemp.

I cannot find a state where the chart always works, but I have found that if I delete the chart, and start from scratch, it will sometimes work with 1 data stream, and sometimes it will work with two data streams. Once I add a third data stream, the chart starts acting weird, i.e. everything looks good in live mode, but in other time intervals, some data shows up, some past data appears but not new data, etc.

In the superchart, I select these options…
title = show
legend = show
x-axis values = show
override auto… = off
allow full screen = on
time ranges = live, 15 min, 30 min, 1 hr, 3 hr, 6 hr, 12 hr.

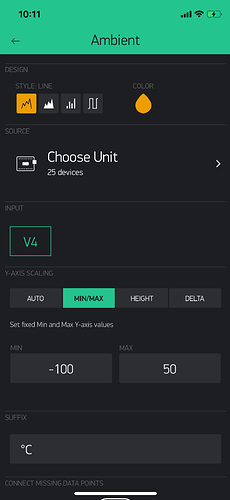
An example of my setup for ambientTemp…
Source = Choose unit
Input = V4
y-axis scaling = min/max
min = -100
max = 50
suffix = degC
connect missing data points = on
y-axis values = show

I made a similar setup for coldSideTemp, except the data is on V3. And right now it looks like the chart is working. I suspect if I add topSensorTemp, the chart will start acting strange… let’s see…

Yup… live works, but on other time intervals, we have stopped getting any new data.

Now I delete the data stream for topSensorTemp, and the chart still does not work right… live works okay, but on other time intervals, we have stopped getting any new data.

I will probably have to delete the chart and start all over to get anything to work again.

Update… I actually have all temperatures showing the superchart now. But to get this to work, it seems I have to have two data streams with a specified unit, and two data streams with “Choose Unit” selected. I can see this is not how the chart is supposed to work, and for my application I really need to have all four data streams with the data source on the “Choose Unit” option.

Update… If I have all data streams coming from a specified unit, the chart works as expected. If I change one data stream to “Choose Unit”, it might work, but it might not… it seems kinda random. If I change two data streams to “Choose Unit”, one of them will probably not work, and maybe both will not work… it’s not consistent.
Anyway, the problem seems to be related to data streams that are on the “Choose Unit” option.

When you say “Choose Unit” do you mean the Source selection feature?

Yes. In the superchart, each data stream has a source selection, and one option is “Choose Unit” for the case where the one project is to be used on different units. See below. It seems the superchart does not really work very well when “Choose Unit” is the source selection. I find that sometimes it works, but most of the time it does not.

No wonder I was confused. My Superchart never shows “Choose Unit”. It either shows the name of an existing device, or on a new project with no devices attached, it shows “New Device”. I have only used Superchart with all datastreams coming from the same Device, so have no experience sending feeds from different devices to the one widget. Will give it a try.

@Nathan2C I found that changing one datastream to a different device caused the Y axis lablel to disappear off the Superchart even though the stream title was still showing. Restoring the datastream to its original device (same device as all other datastreams) also restored the Y axis label and displayed the appropriate data.

So it does appear that there may be a bug.

@Nathan2C should be fixed now. Thanks for the report.

1 Like

Everything seems to work now. Looks great. Let’s call this one Solved. Thanks!

1 Like