Hello, over the last week or so the data traces on my superchart are sometimes hidden.
On all charts except “live”: I can usually see the shadow fill below the data traces. The bright line is missing. If I swipe left or right, the lines sometimes show up, but then disappear again if I swipe some more. Every time I swipe to the end of the timeline (to the current time) the data trace appears for a second or two, but always disappears again.
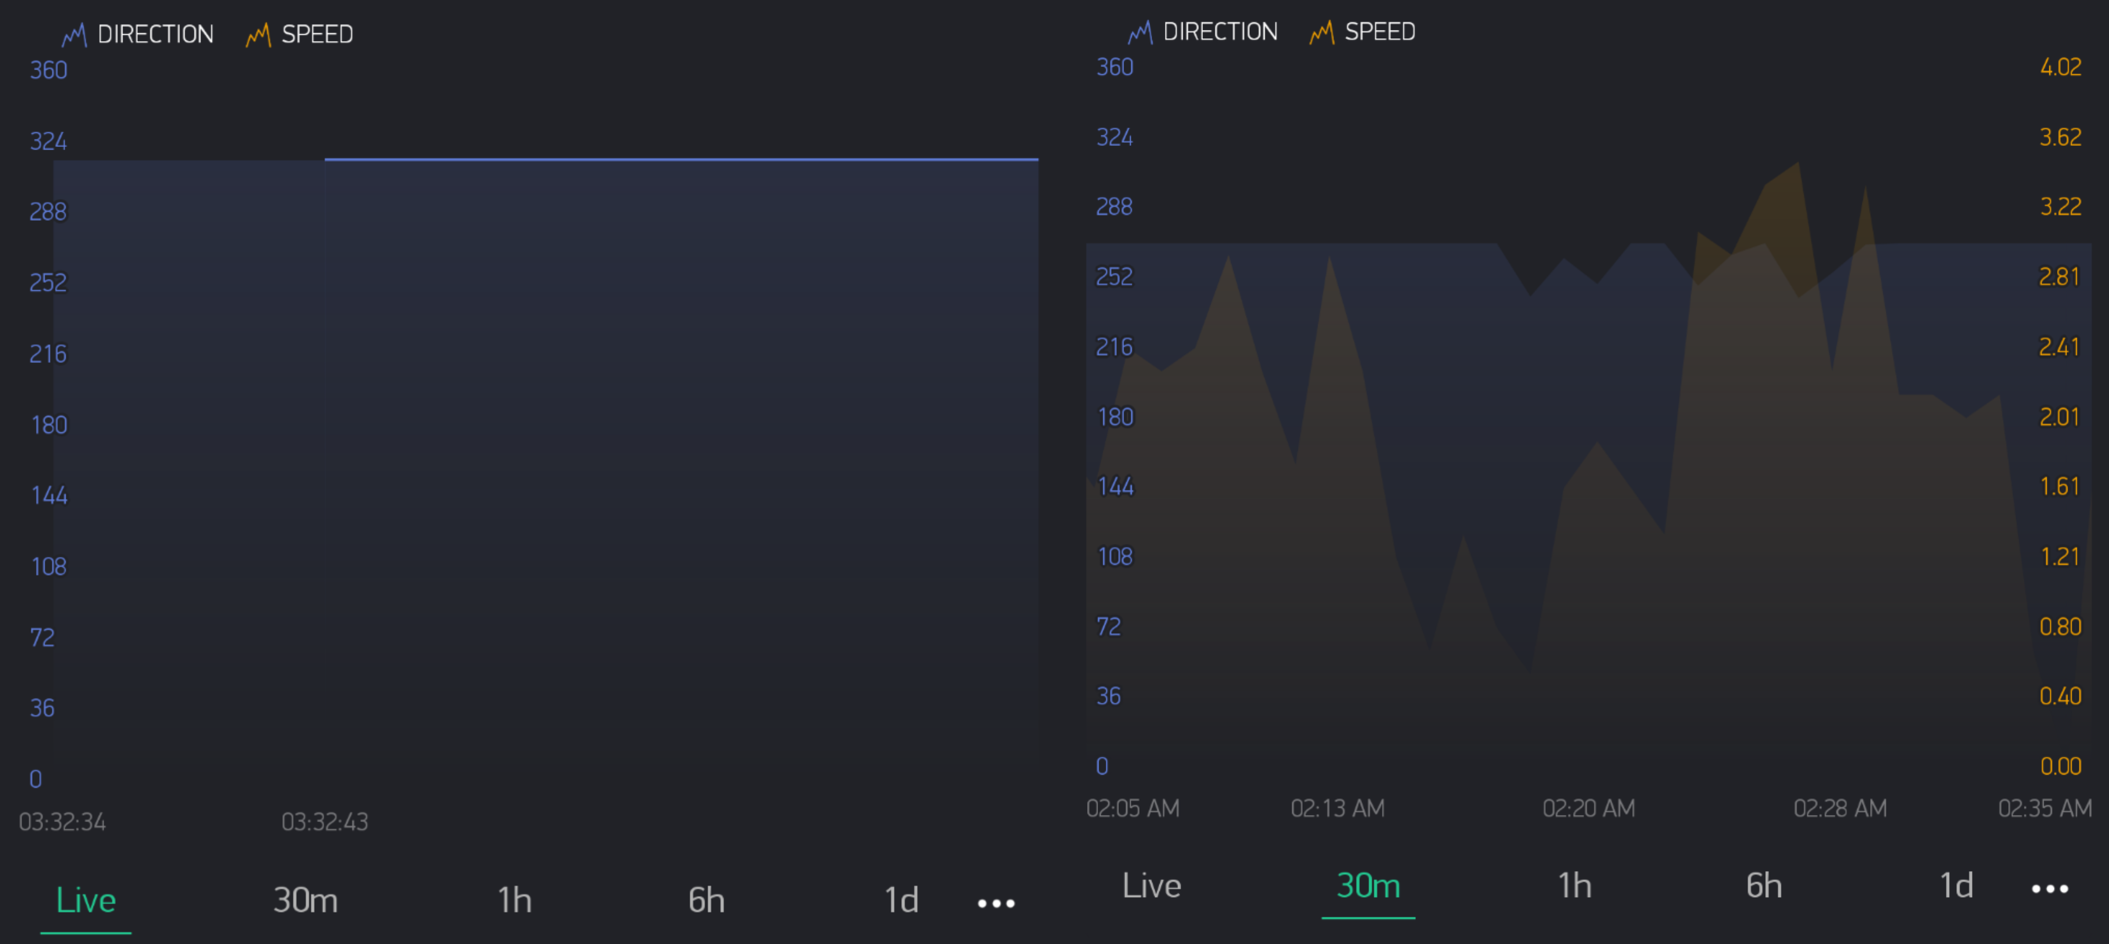
On the “live chart”, the data from one stream doesn’t seem to be getting through. Two data streams show up in the legend, but only one is visible on the chart. The one data stream that shows up, is just a shadow and the data just a flat line that looks incorrect (the data should be changing). On the chart, I can’t swipe at all until after many seconds have passed, because it seems to only display data from the time I start viewing the chart.
See pictures attached below. I hope this isn’t too much to report in one post. It all seems related to me. I am happy to provide further details if needed. Thanks for the help!