Superchart shows only Live data but not other time intervals

I was using the Blynk legacy app and have recently shifted to the new Blynk app.
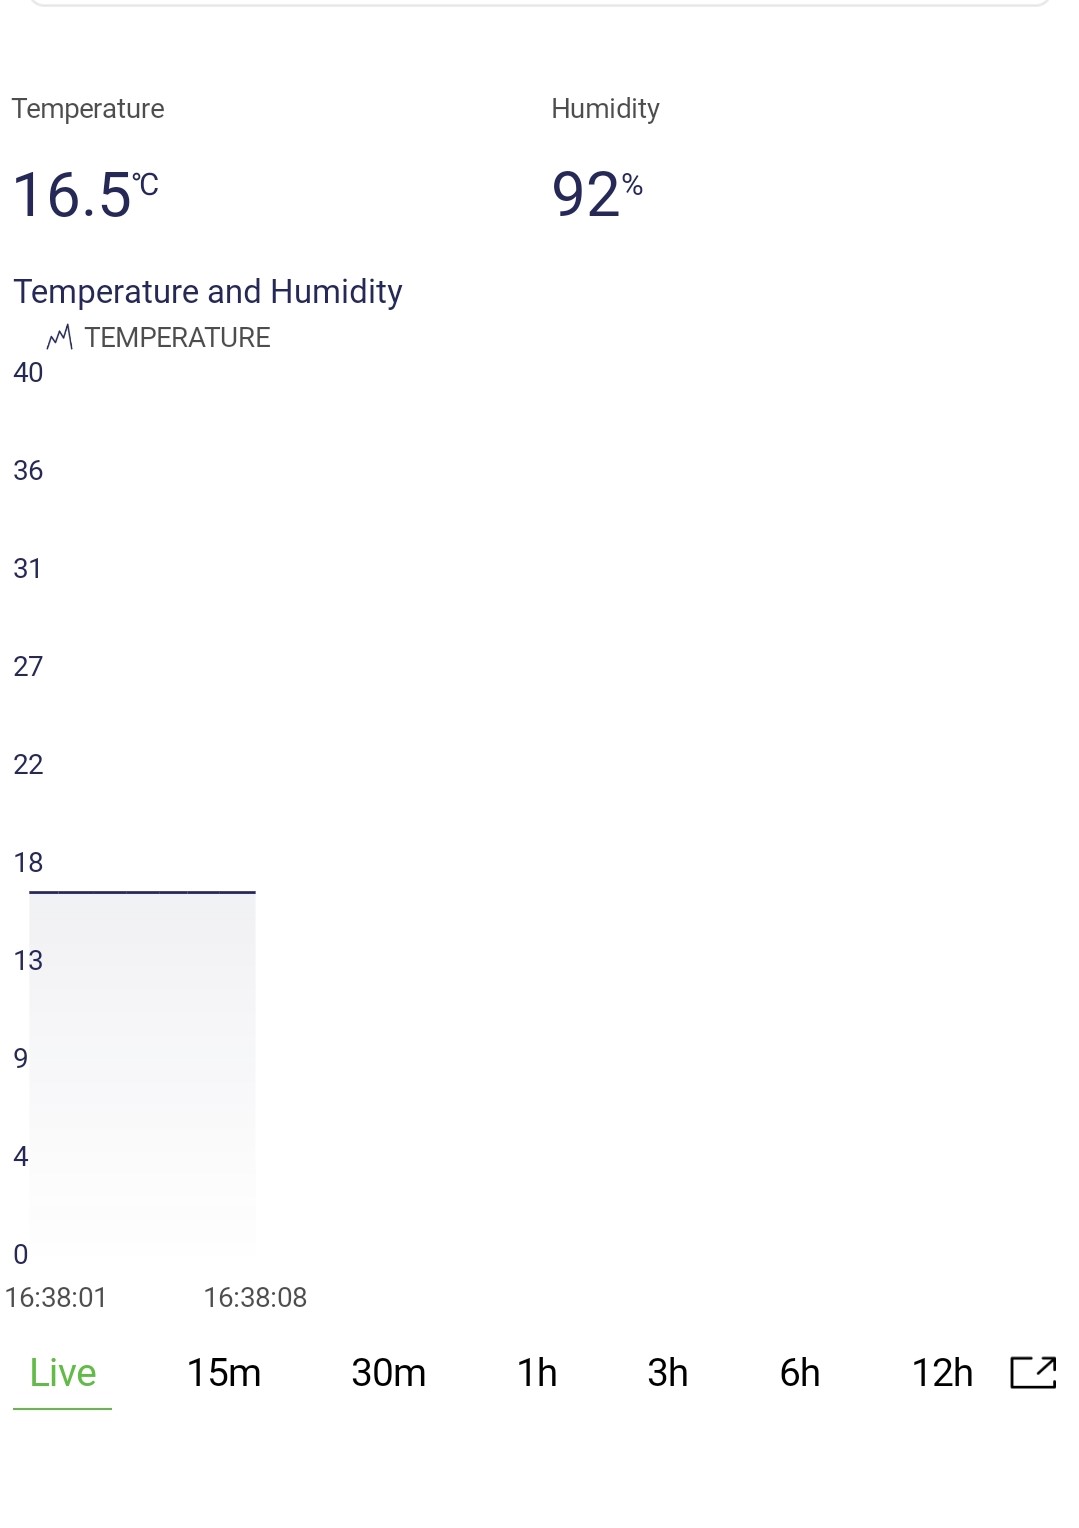
I am trying to get familiar with the new platform by implementing a small project where I plot the Temperature and Humidity data on Superchart and see the historic data as well.

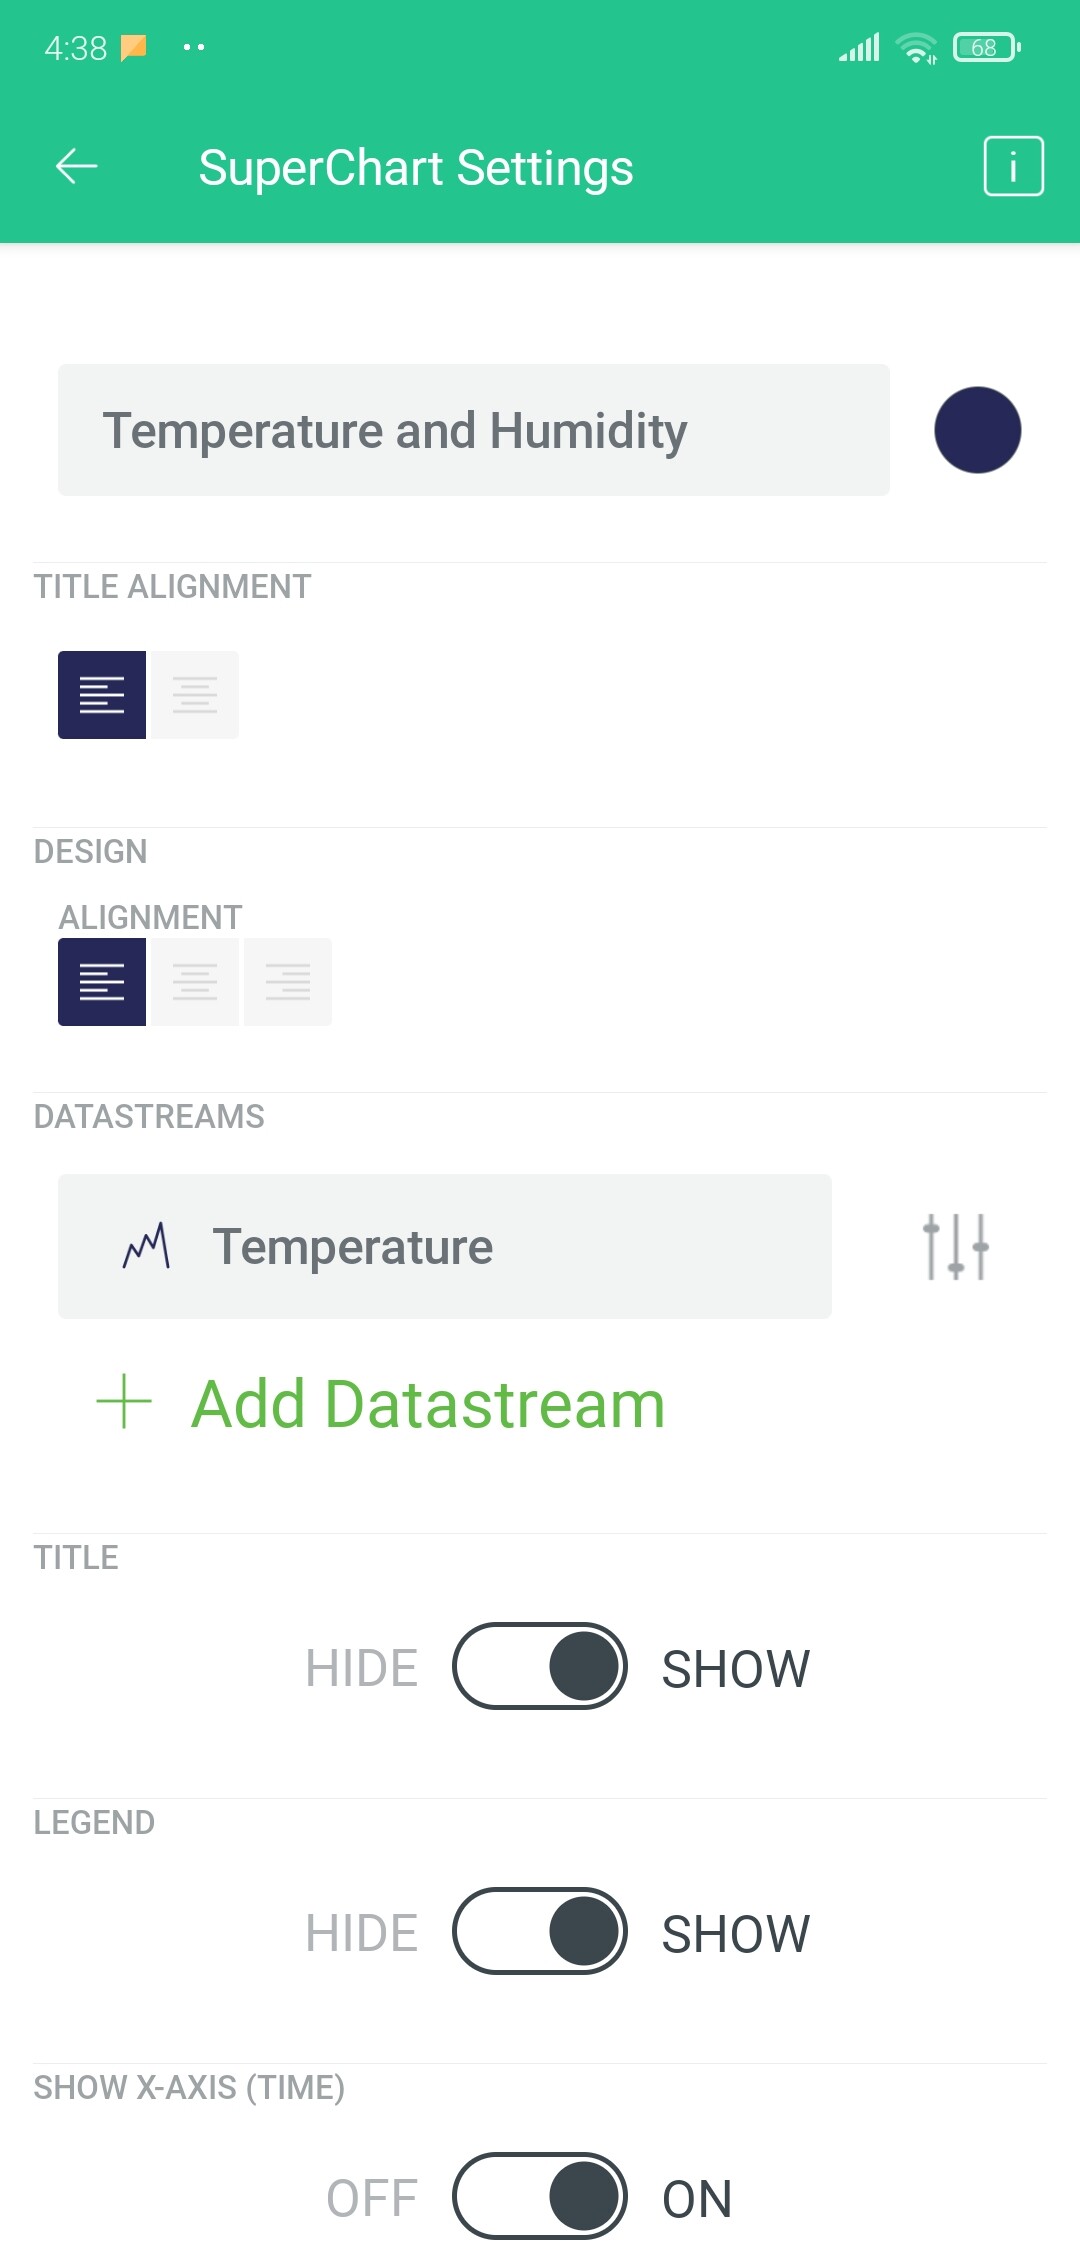
While using Superchart I realized I couldn’t see the second stream, which is Humidity values. Confirm me if this is limitation of using free tier.
Also, the app does not collect the data when it goes in background, it starts displaying me the live data afresh every time I open the app.
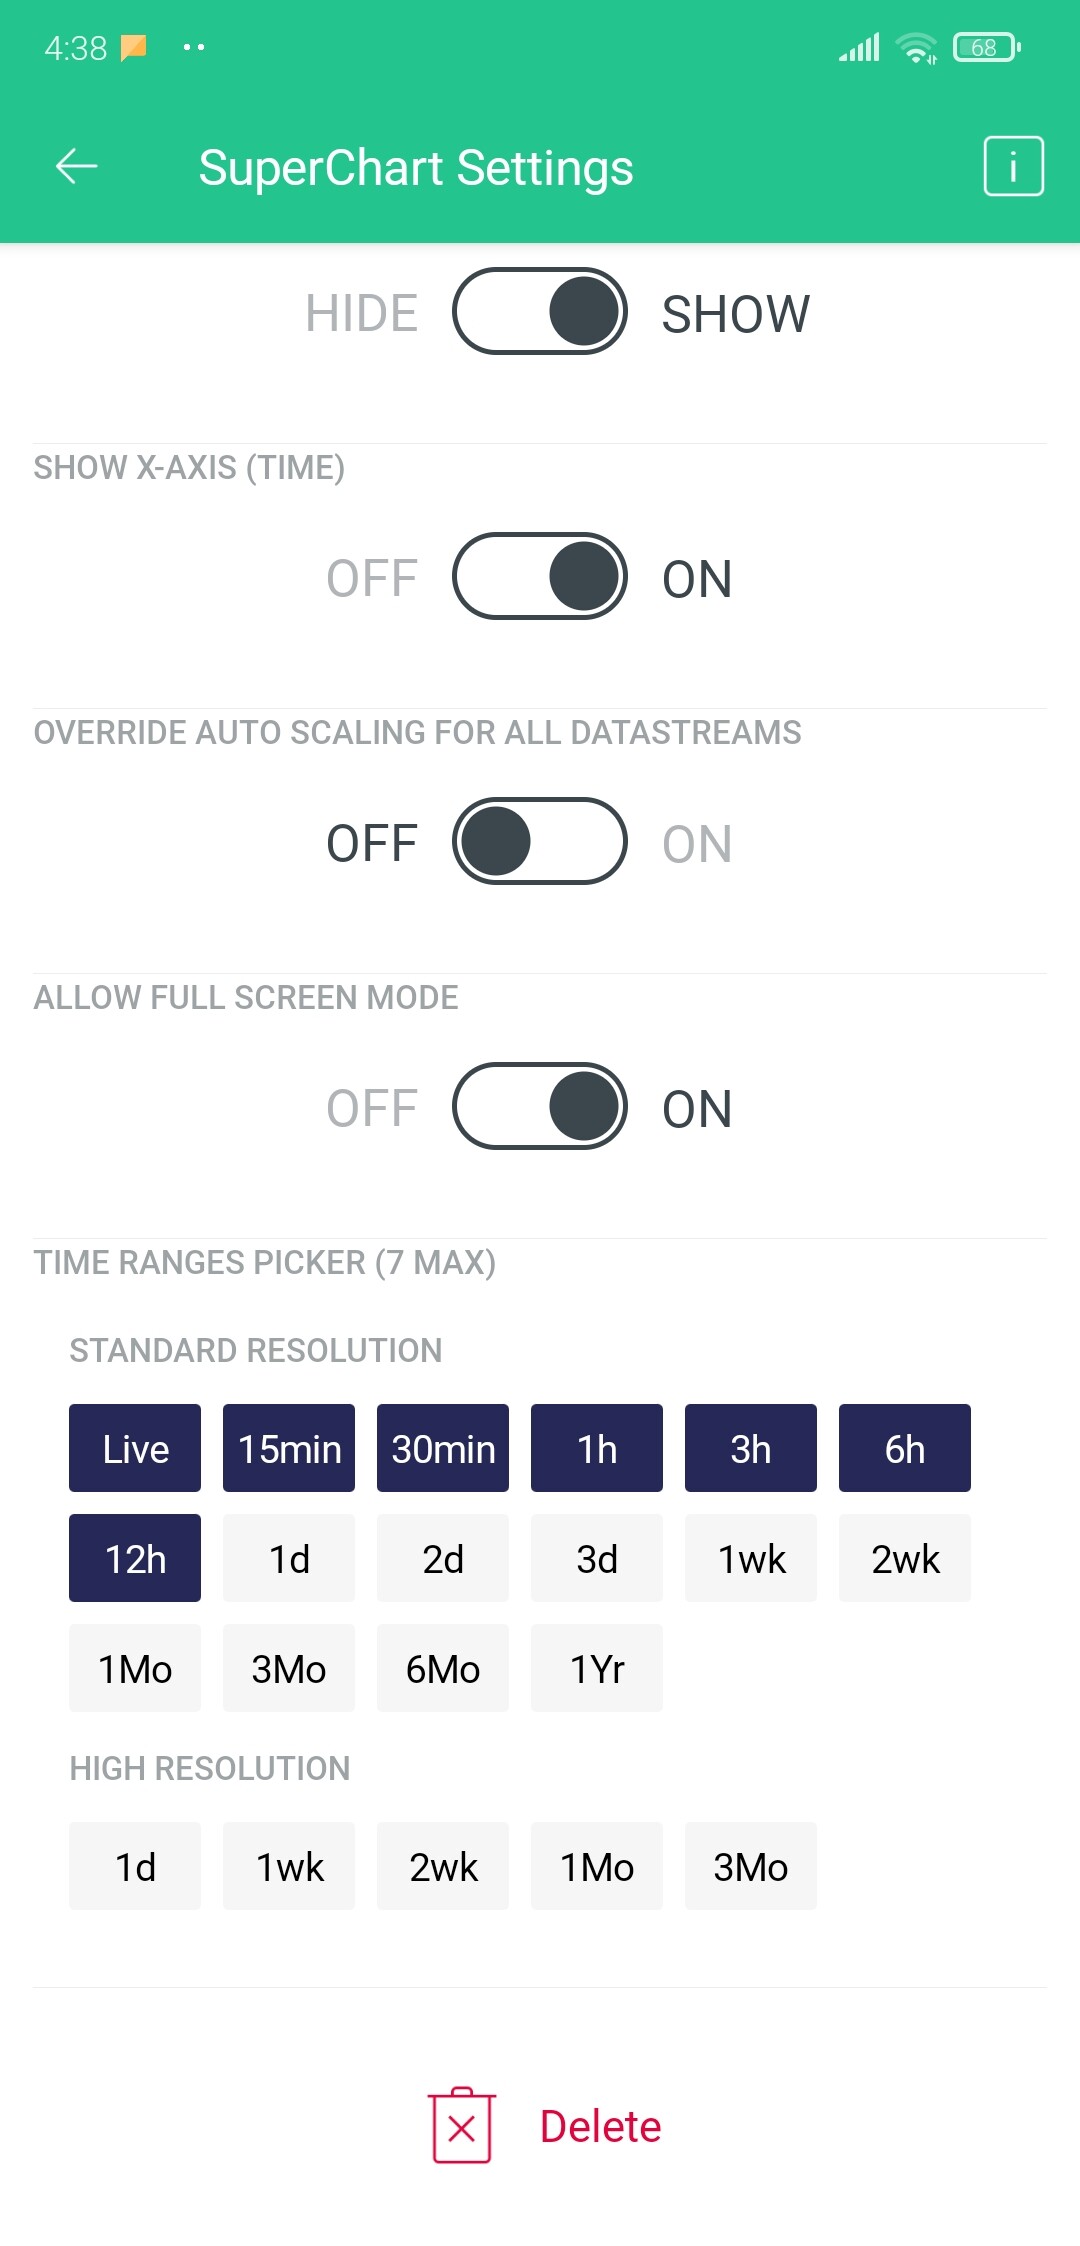
the third issue is that I cant see data at any interval other than ‘Live’.
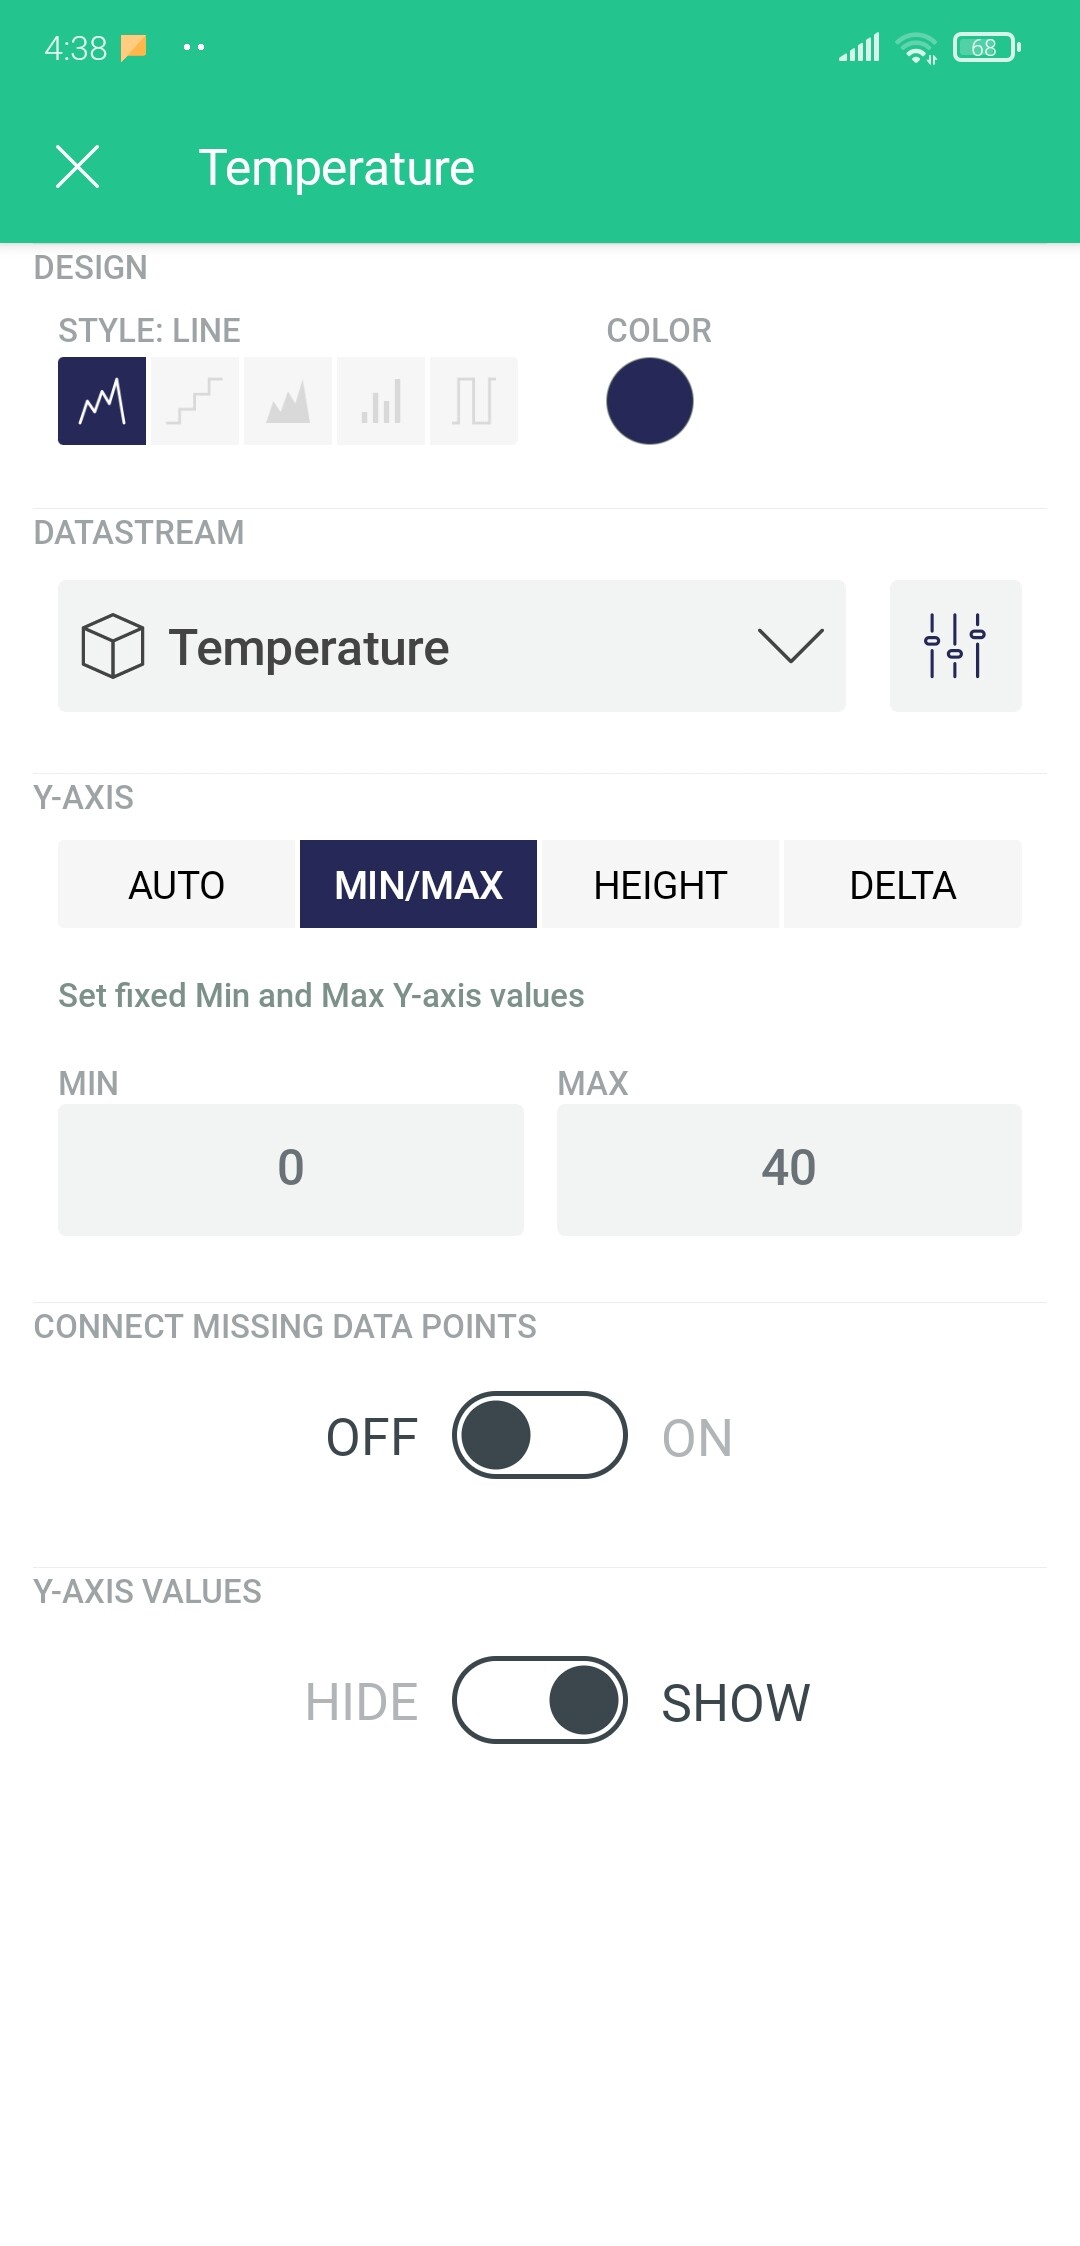
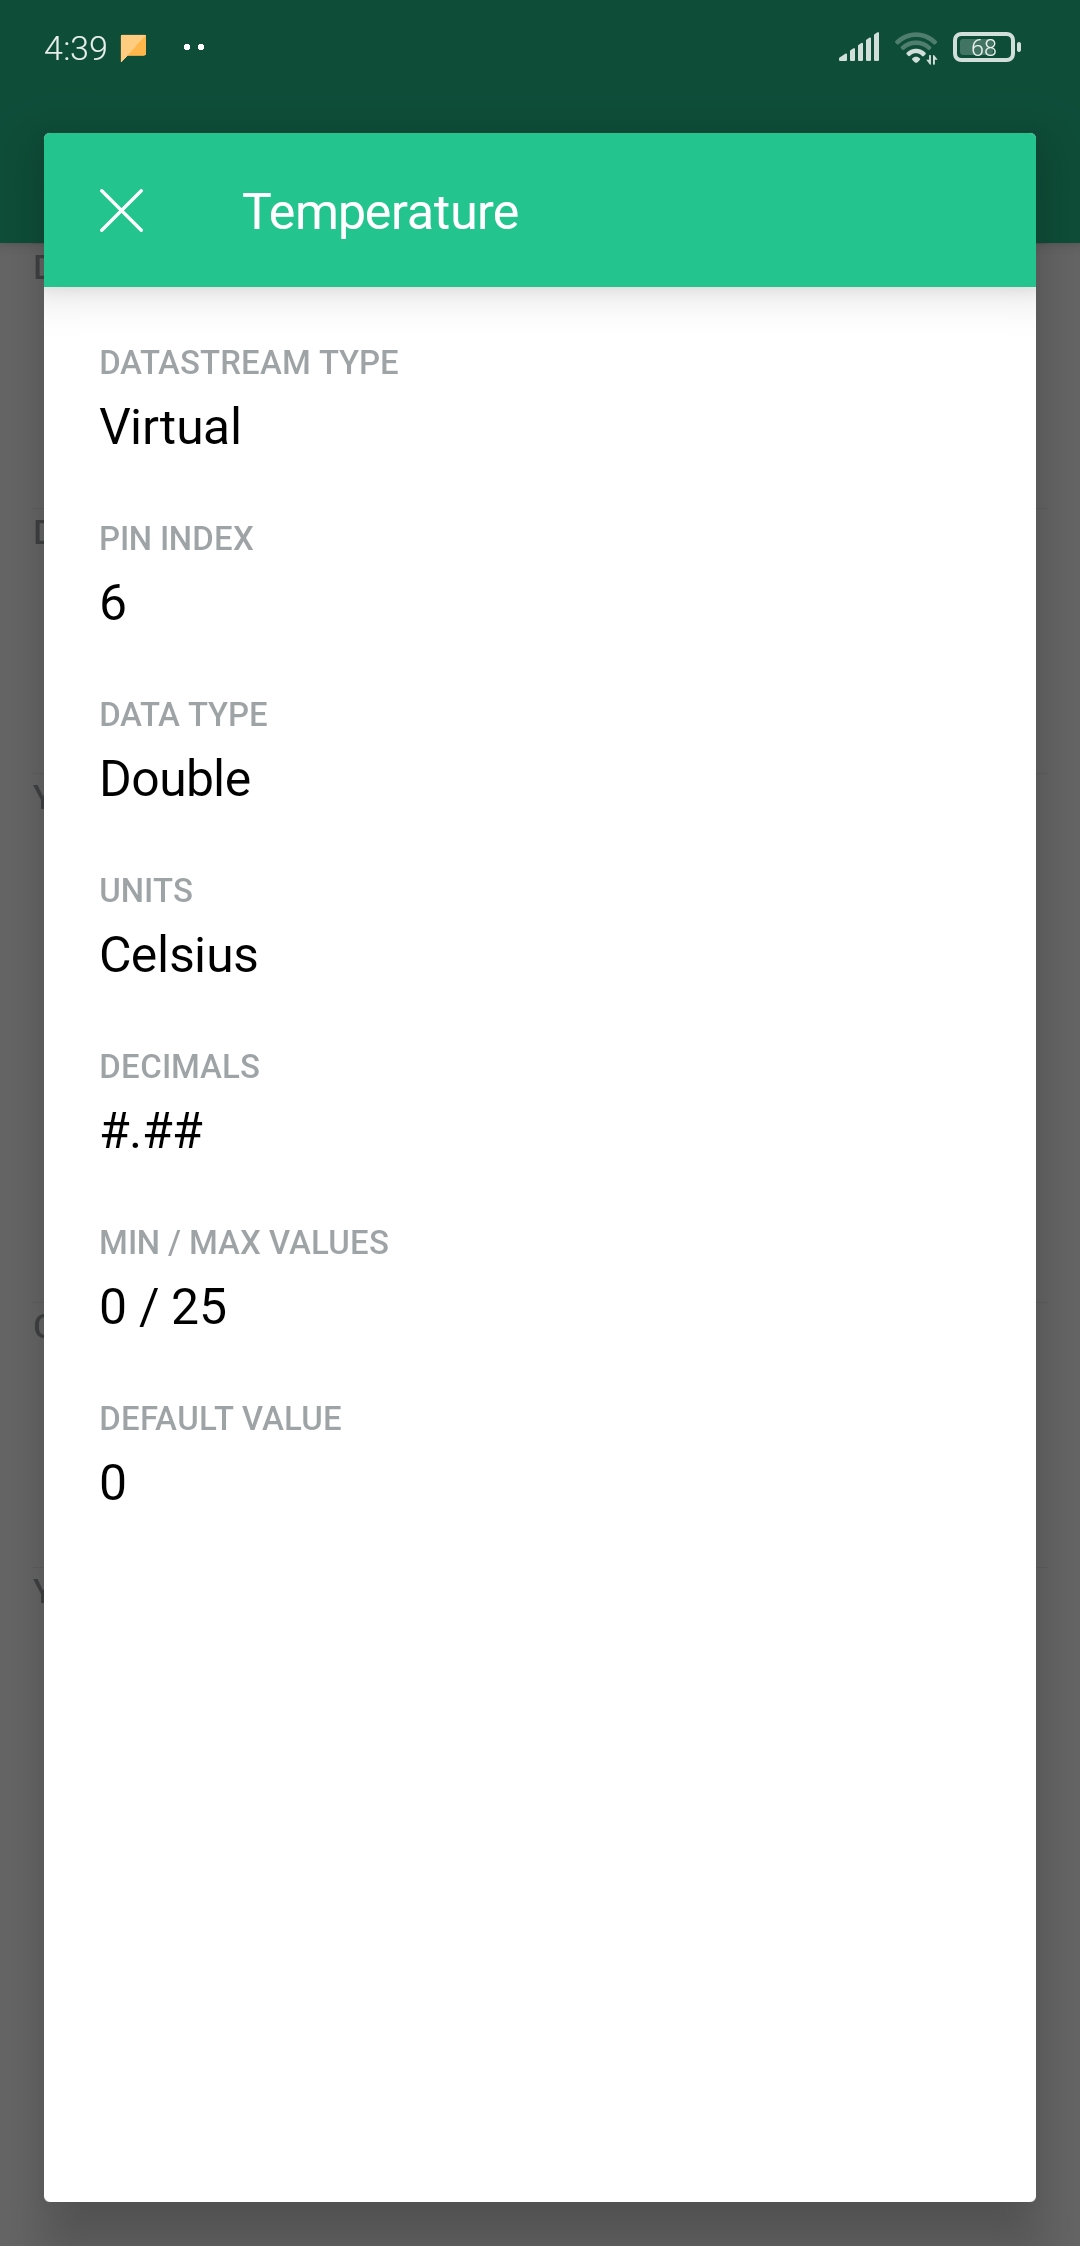
To clarify beforehand, I’m using float variables to read the sensor and sending the same variable values to Blynk.
This is a bit frustrating for me. Can you guys please help me out with it?

Confirmed…

Basic Widgets include:

  • Button
  • Slider: horizontal
  • ZeRGBa
  • Joystick
  • Simple Value Display
  • LED
  • Simple Gauge
  • LCD
  • Super Chart - Single Datastream
  • Terminal
  • Music Player Controls
  • Tabs (2 tabs max)

Yes, if you choose Live as time period, it will do that I believe.

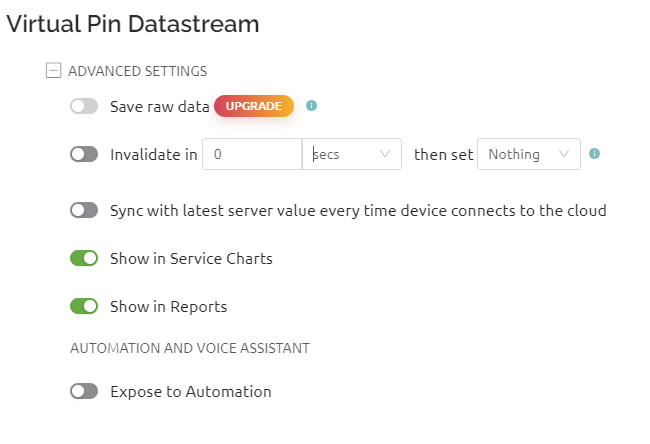
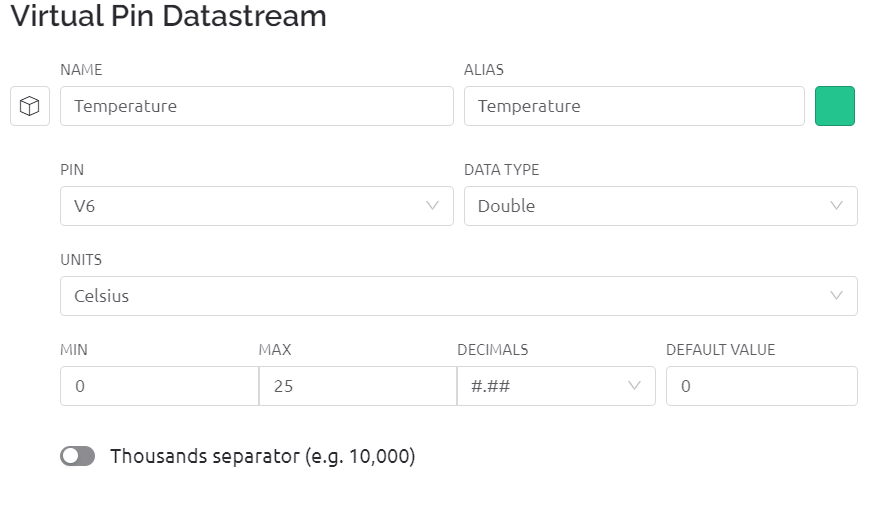
Do you mean that “Live” is the only data interval that is available for selection, or that you can see the other data intervals, but that there is no data displayed? Screenshots would help, along with info of how you’ve configured the display option for the datastream you are using.

How is your datastream configured?

Pete.

Thanks a lot for such a quick response.
I really appreciate it!!

In legacy app, even if I chose live view, the data used to get collected over period and charts used to be available whenever I chose any other interval. I have collected 24hrs data using the same method.

No, other intervals are also available but they are not displaying when I tap any of them.

Check the screenshots attached.!

I’ll upload the other screenshots in next responses. The site is not allowing me to upload more than one picture.

Thanks a lot in advance
Nishkarsh

It would be useful if you posted the web view of your datastream configuration, with the Advances settings expanded.

It would also be helpful to see your code - correctly formatted with triple backticks of course.
Triple backticks look like this:
```

Pete.

image

#define BLYNK_TEMPLATE_ID "TMPLMANgtdbD"
#define BLYNK_DEVICE_NAME "DHT"
#define BLYNK_FIRMWARE_VERSION "0.1.0"
#define BLYNK_PRINT Serial
#define APP_DEBUG
#include <DHT.h>
#define USE_NODE_MCU_BOARD
#include <BlynkEdgent.h>


#define DHTPIN 13          // Digital D7
#define DHTTYPE DHT11     // DHT 11
DHT dht(DHTPIN, DHTTYPE);
//SimpleTimer timer;

unsigned long previousTime = 0;
unsigned long eventInterval;
unsigned long currentTime;


void setup() {
  // put your setup code here, to run once:
  Serial.begin(9600);
  delay(100);
  BlynkEdgent.begin();
  dht.begin();
}

void loop() {
  // put your main code here, to run repeatedly:
  BlynkEdgent.run();
  currentTime = millis();
  if (currentTime - previousTime >= eventInterval)
    {
      previousTime = currentTime; 
      float h = dht.readHumidity();
      float t = dht.readTemperature();
      
      Serial.print("\nHumidity: ");
      Serial.println(h);
      Serial.print("Temperature: ");
      Serial.println(t);

      int l = 0; sendData(l, h, t);     //      sendData(l, h, t);
      delay(500);
    }
}

void sendData(float l, float h, float t)
{
  if (isnan(h) || isnan(t)) {
    Serial.println("Failed to read from DHT sensor!");
  }
  else{
    Blynk.virtualWrite(V5, h);  //V5 is for Humidity
    Blynk.virtualWrite(V6, t);  //V6 is for Temperature
    Serial.println("Data sent to Bkynk!!");
    }
  delay(200);
}

Okay, you should start by reading this…

https://docs.blynk.io/en/legacy-platform/legacy-articles/keep-your-void-loop-clean

I actually wanted to see all of the datastream settings, including the advanced settings, not just the advanced settings.

Also, the code that needs to come out of your void loop, and the code in your sendData function need to be combined.

Take a look at this example…

Pete.

Recommended changes done

#define BLYNK_TEMPLATE_ID "TMPLMANgtdbD"
#define BLYNK_DEVICE_NAME "DHT"
#define BLYNK_FIRMWARE_VERSION "0.1.0"
#define BLYNK_PRINT Serial
#define APP_DEBUG
#include <DHT.h>
#define USE_NODE_MCU_BOARD
#include <BlynkEdgent.h>
BlynkTimer timer;

#define DHTPIN 13          // Digital D7
#define DHTTYPE DHT11     // DHT 11
DHT dht(DHTPIN, DHTTYPE);

void setup() {
  // put your setup code here, to run once:
  Serial.begin(9600);
  delay(100);
  BlynkEdgent.begin();
  dht.begin();
  timer.setInterval(1000L, sendData(h, t))
}

void loop() {
  // put your main code here, to run repeatedly:
  BlynkEdgent.run();
  timer();
}

void sendData(float h, float t) // float l, 
{
  float h = dht.readHumidity();
  float t = dht.readTemperature();
      
  Serial.print("\nHumidity: ");
  Serial.println(h);
  Serial.print("Temperature: ");
  Serial.println(t);
  if (isnan(h) || isnan(t)) {
    Serial.println("Failed to read from DHT sensor!");
  }
  else{
    Blynk.virtualWrite(V5, h);  //V5 is for Humidity
    Blynk.virtualWrite(V6, t);  //V6 is for Temperature
    Serial.println("Data sent to Bkynk!!");
    }
}

DataStream Settings -
This concludes all the settings in DataStream.

You’ll usually get much better results if you increase this to one reading every 5 seconds with the DHT sensors.

Are you seeing any different results in the Superchart?

Pete.