Hi
Possibly an Android 9 (Pie) related issue, as I upgraded last night and Blynk is exhibiting this issue today, but for whatever reason …
When scrolling the SuperChart, in both the ‘project screen’ and in its expanded form, the plot will ‘grey out’. I have two data series being plotted and either one or both will be affected. Can send screen shots if needed and this is not a known problem.
As it seems I can get no advice here, can anyone tell me where I should report this issue ‘formally’ and get some suggestions as to things I should try to resolve my problem, please?
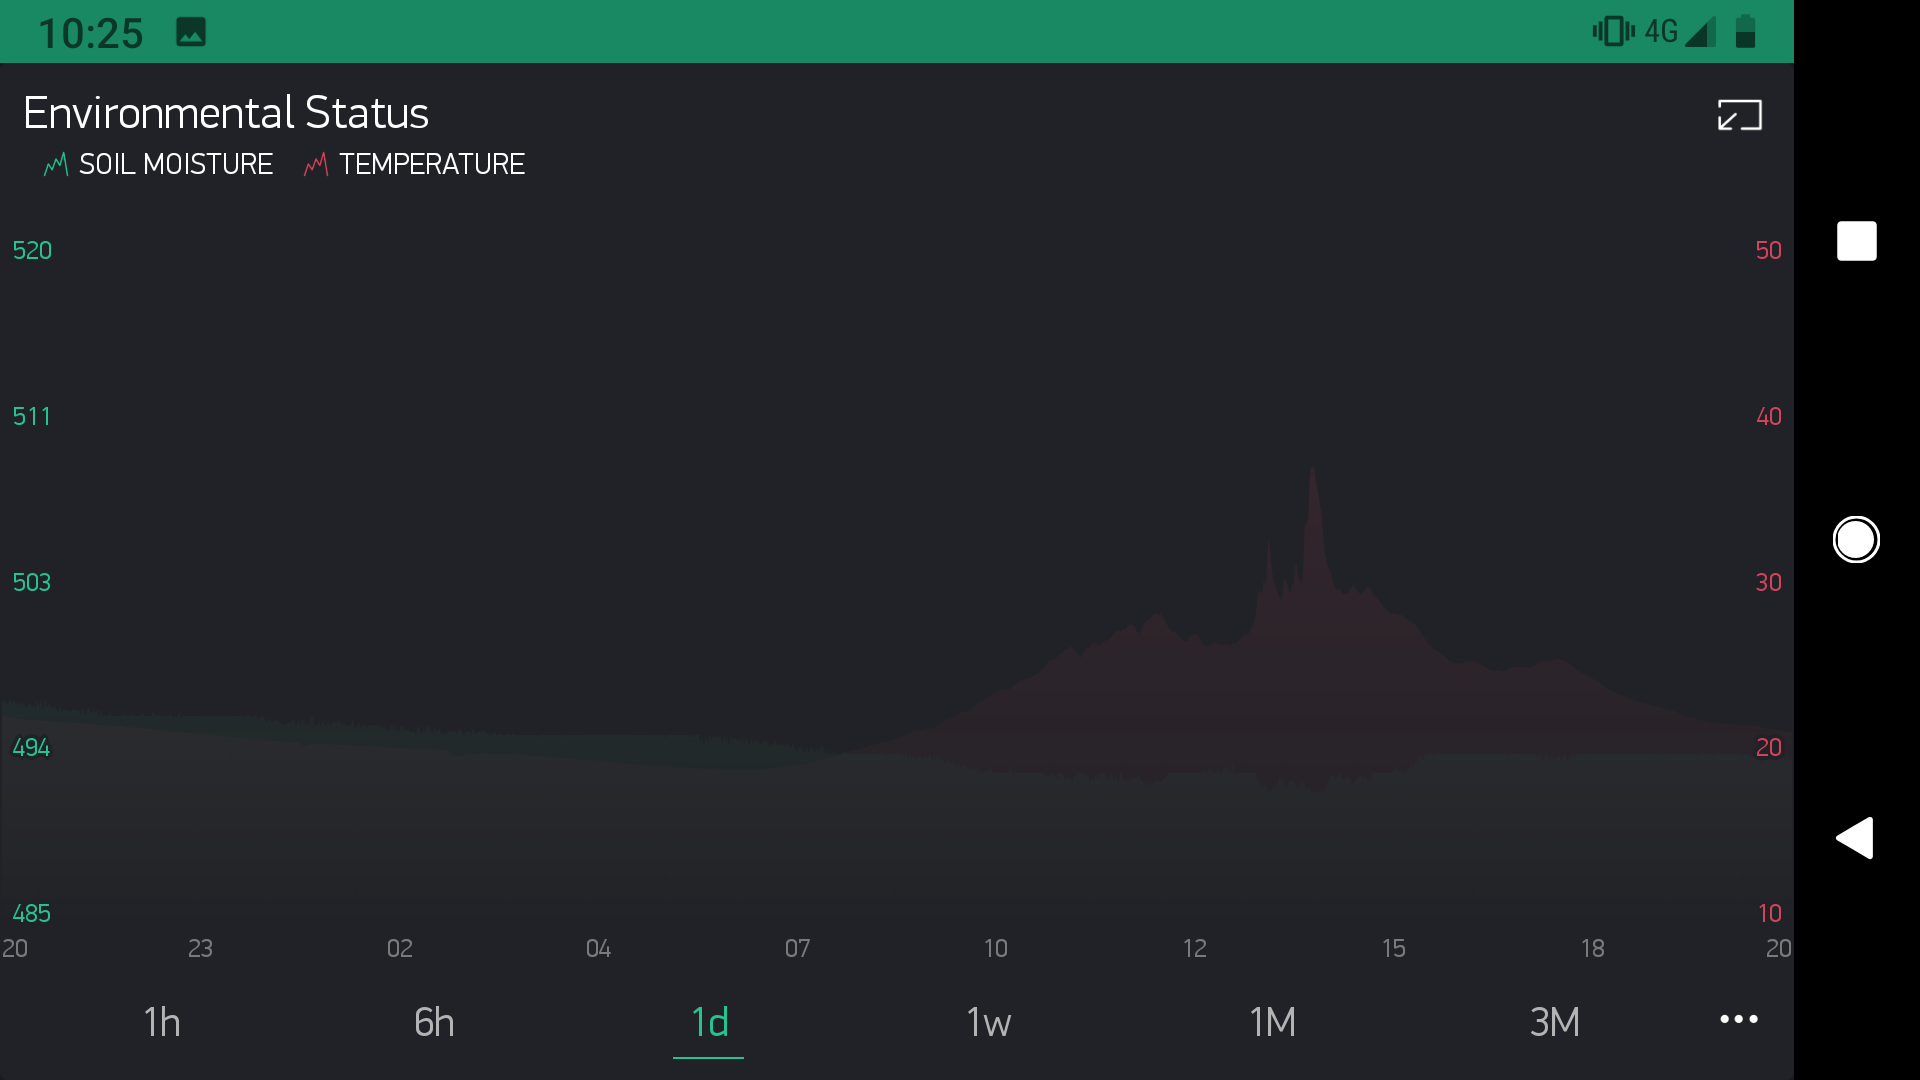
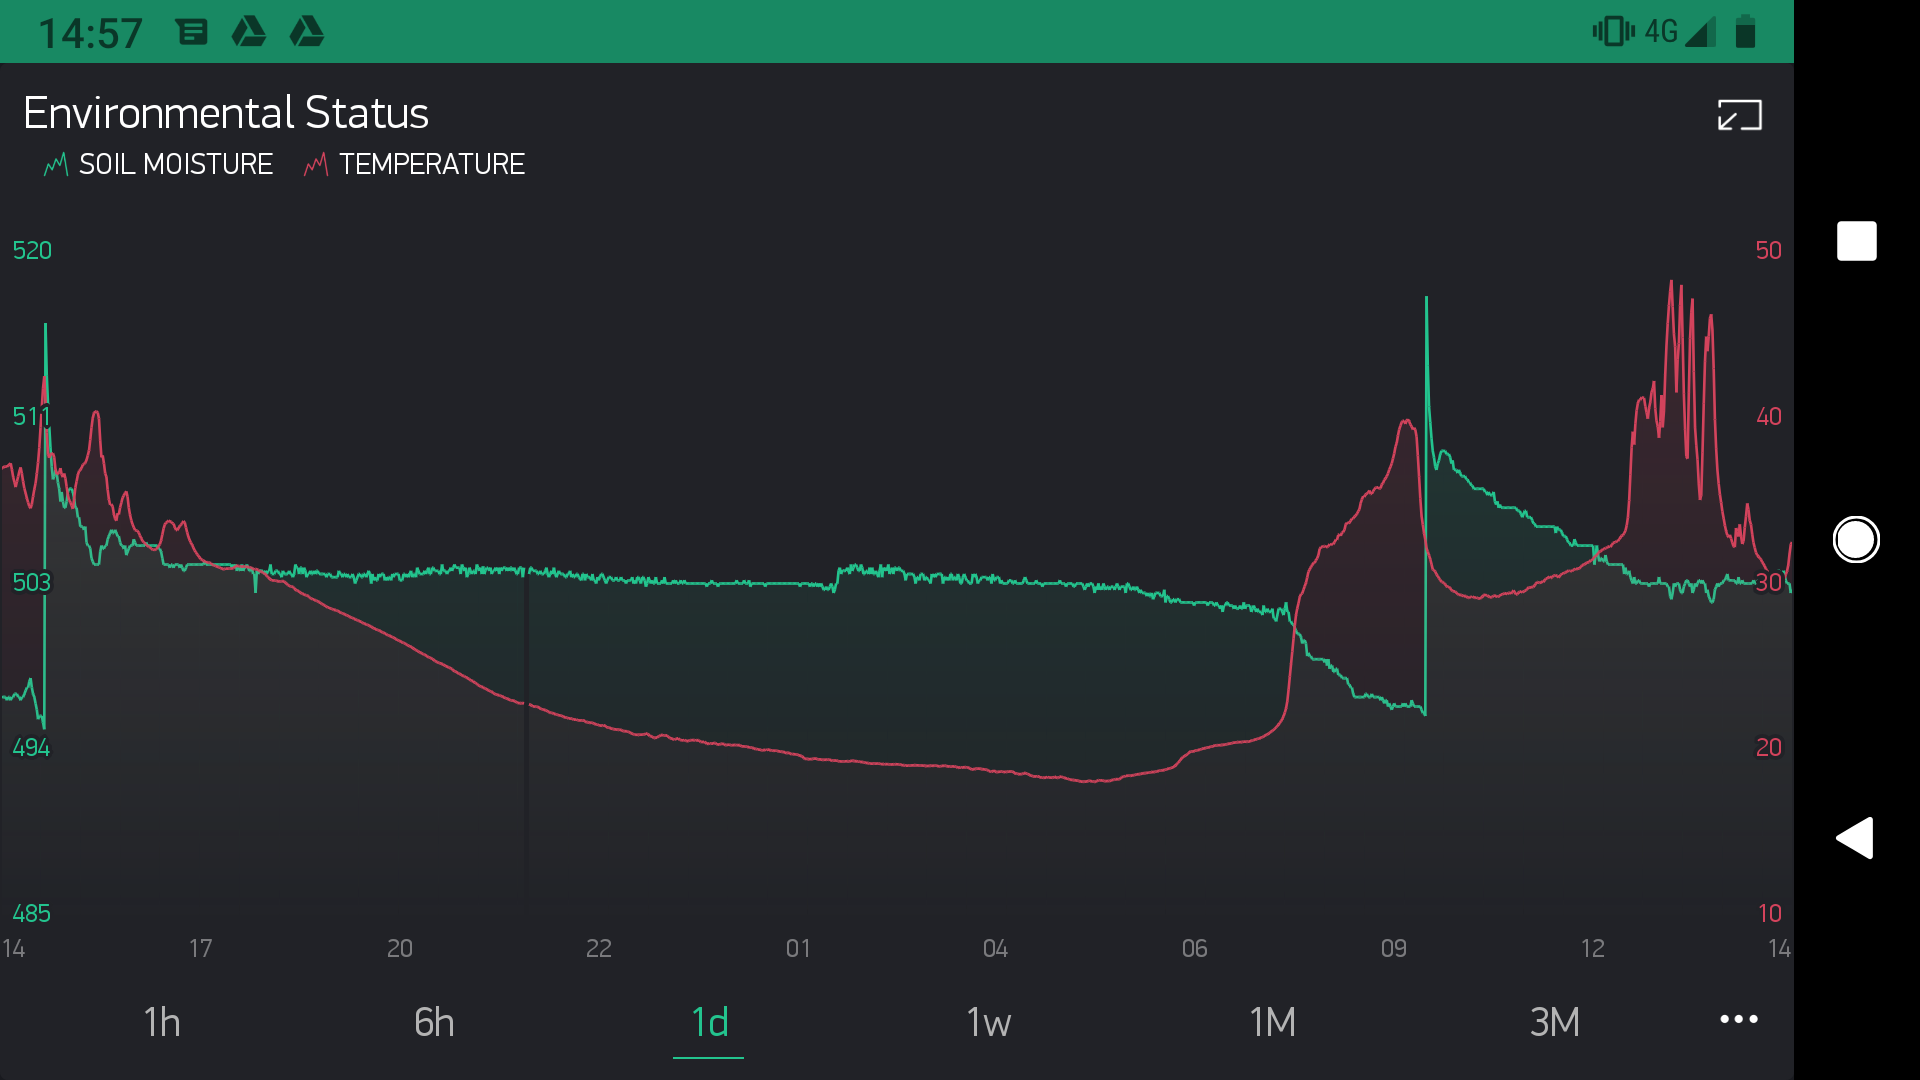
‘Ok’ shows the SuperChart as it is first displayed, and this is, as far as I recall, always fine.
As soon as the screen is scrolled, one or the other, or both series lines disappear leaving only the faintly coloured area shown. ‘moisture’ shows one of the lines gone and ‘both’ is obviously both missing.
I hope this is helpful and you can suggest things I may try.
BTW the phone is a Pixel 2.
(It turns out that due to a restriction on my account I can only upload 1 image, so attached is the one showing both lines missing)
Seems to always work fine when not connecting missing points, even if the display does not include missing points.
It also forces the respective line to show, i.e. if the red line only has connect missing set to ignore, then it seems to always show, while the green will often vanish.
Pretty sure I’m having the same issue as you. The line is there, but super hard to make out. I was looking for a way to increase the line weight… But might be looking for a solution that doesn’t exist yet.
A.