Superchart doesn't show max values in week/month range

Before creating the topic

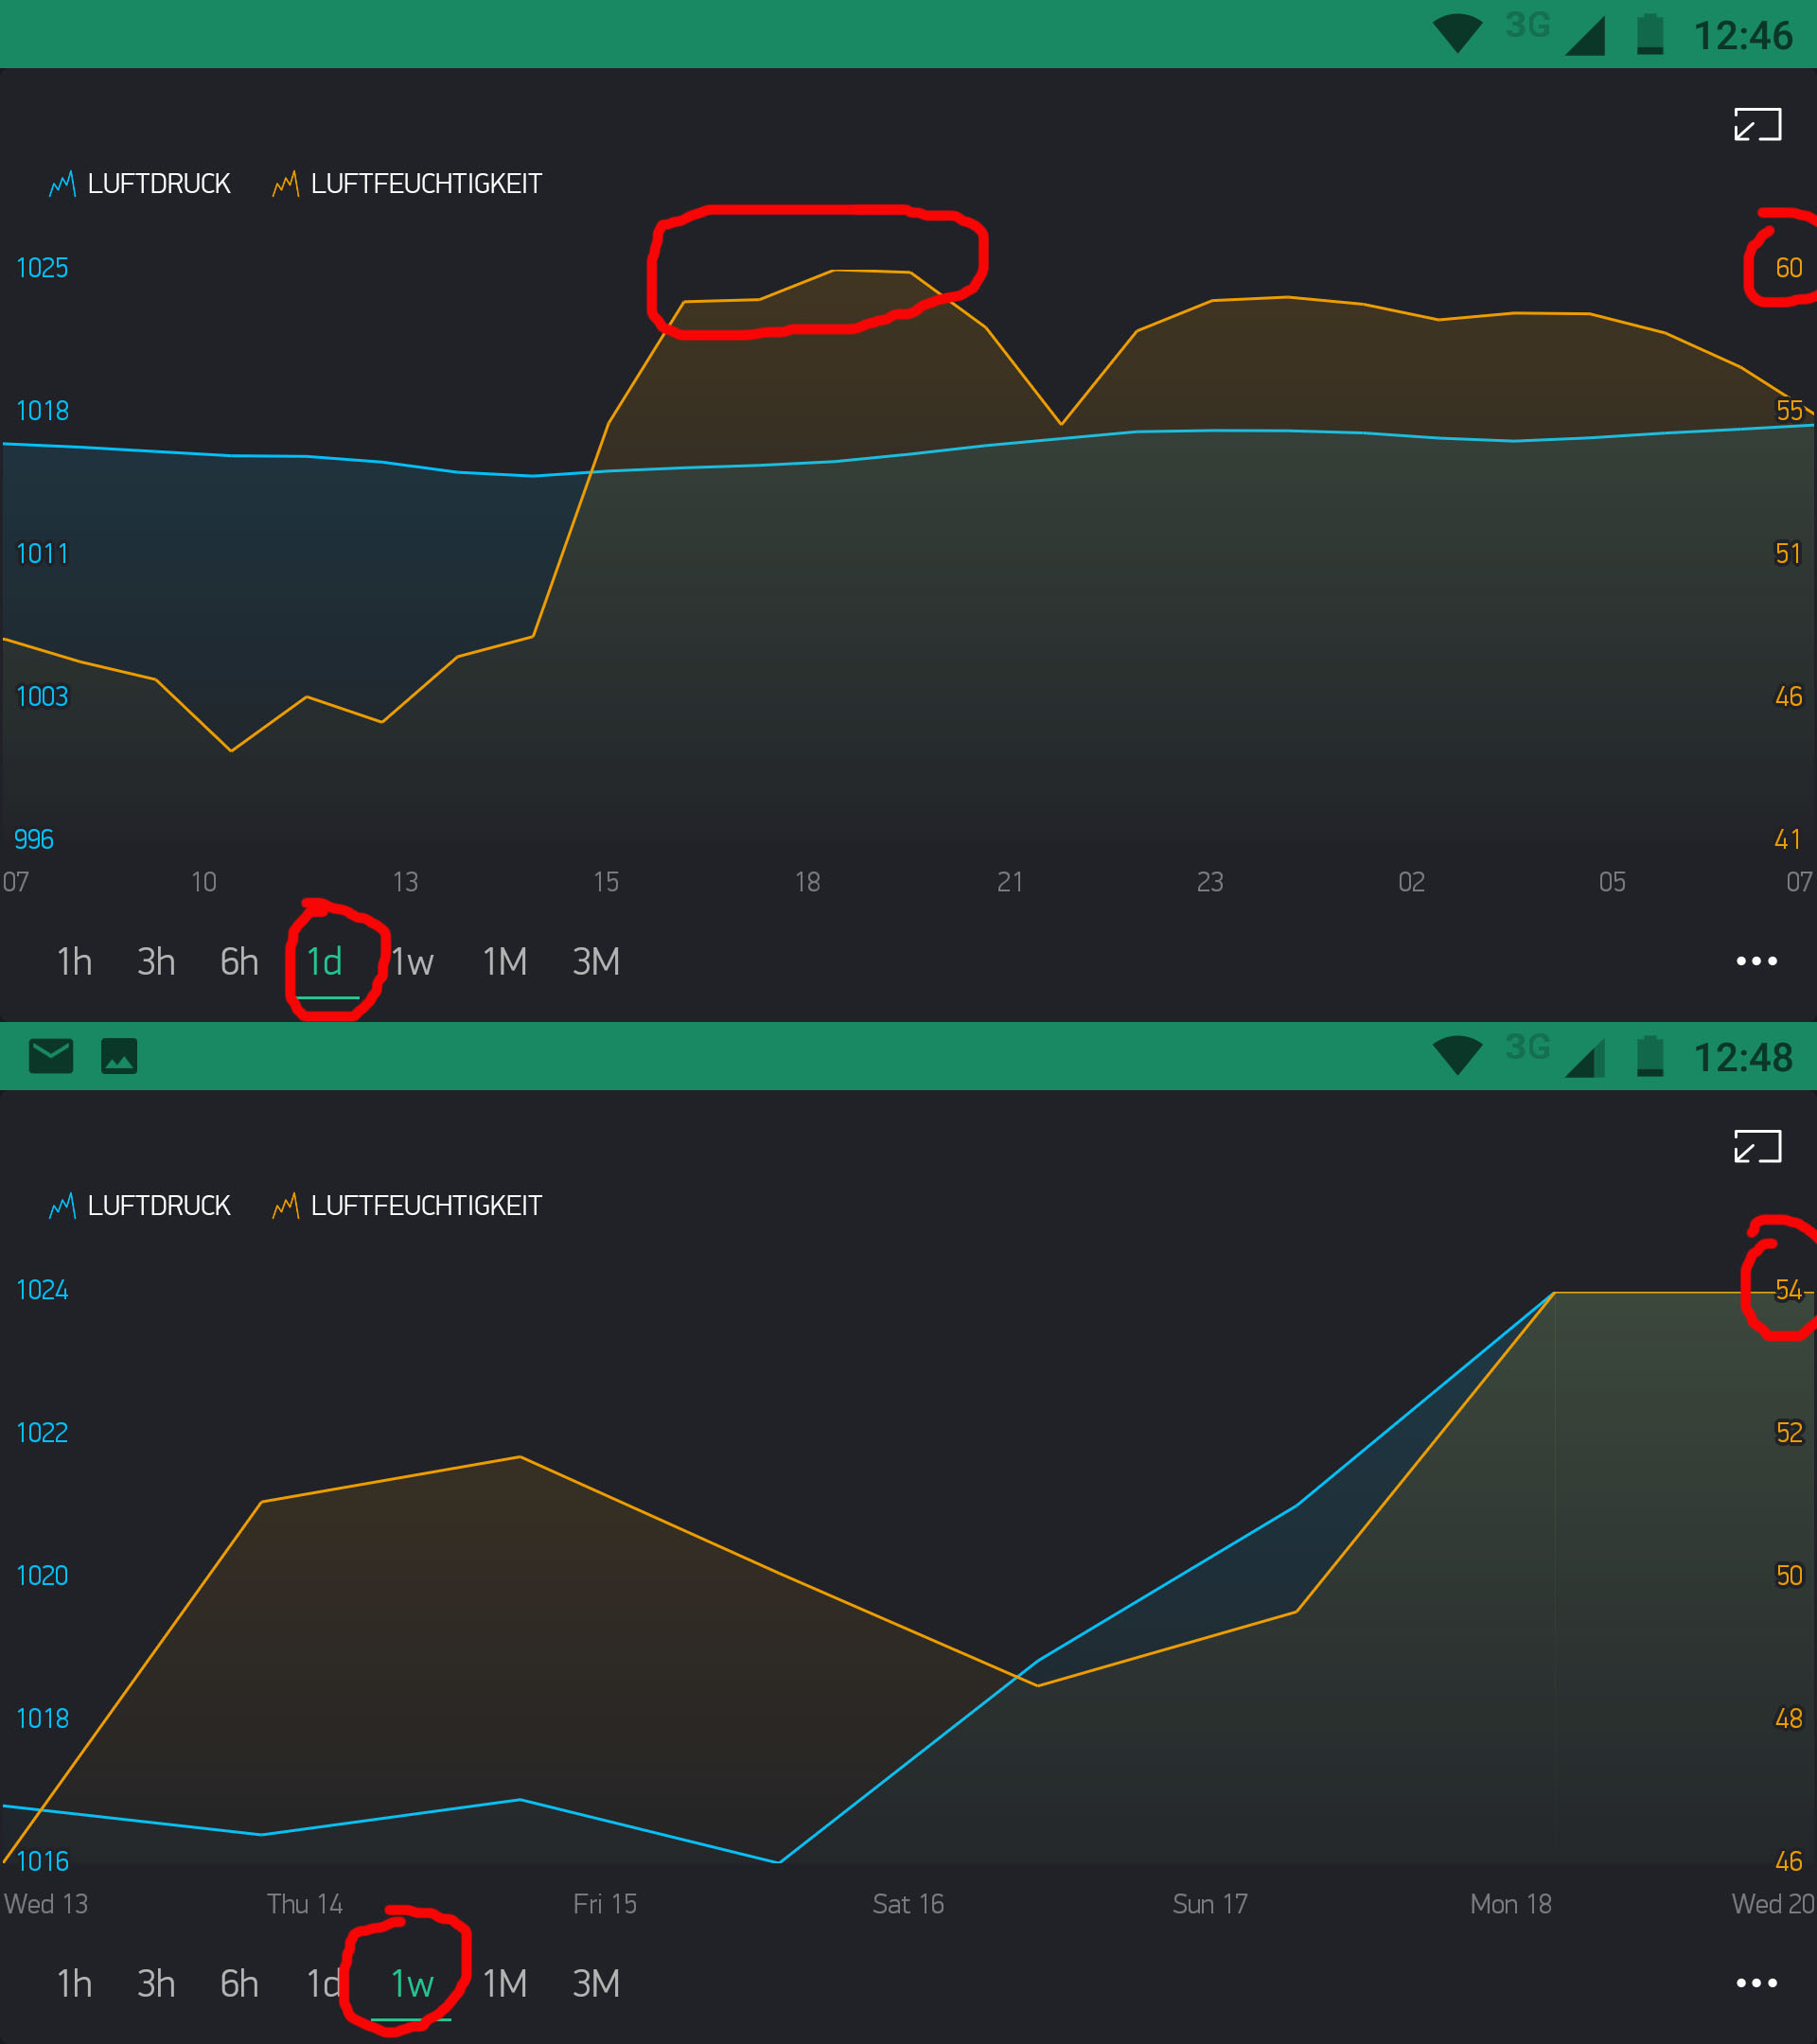
I measure the values for air pressure (blue) and humidity (orange) with a bme280 sensor.
Problem:
Superchart doesn’t show max values when week or month range is selected. For example i had a reading of 60% humidity, which is seen in the 1d graph. When i select 1week range, the max value is 54%. Where is the 60% value?
Is there some averaging going on in the background? Is this a bug?

ESP8266 Dev Kit WIFI Lolin Amica CP2102 v2 + Wifi
Motorola G5 + Android 7.0
Blynk server
Blynk Library 0.5.3


void setup()
{
  Serial.begin(9600);

  //Blynk
  Blynk.begin(auth, ssid, pass);
  // You can also specify server:
  //Blynk.begin(auth, ssid, pass, "blynk-cloud.com", 8442);
  //Blynk.begin(auth, ssid, pass, IPAddress(192,168,1,100), 8442);

  timer.setInterval(10000L, myTimerEvent);

  //BME280
  Serial.println(F("BME280 test"));
  bool status;
  Wire.begin(D3, D4); // NodeMcu -> SDA = Pin D3; SCL = Pin D4
  // default settings
  // (you can also pass in a Wire library object like &Wire2)
  status = bme.begin();
  if (!status) {
    Serial.println("Could not find a valid BME280 sensor, check wiring!");
    while (1);
  }
  Serial.println("-- Default Test --");


  Serial.println();


}


void loop()
{
  getP();
  Blynk.run(); 
  timer.run(); 
  delay(1);
}

void myTimerEvent()
{

  Blynk.virtualWrite(V5, bme.readTemperature());
  //Blynk.virtualWrite(V6, (bme.readPressure() / 100.0F)+ 20.83F); // 100.0F = float Wert
  Blynk.virtualWrite(V6, Pressure);
  Blynk.virtualWrite(V7, bme.readHumidity());

  printValues();
}

void printValues() {
  Serial.print("Temperature = ");
  Serial.print(bme.readTemperature());
  Serial.println(" *C");

  Serial.print("Pressure (Höhenkorrigiert) = ");
  // 'nilton61'  http://forum.arduino.cc/index.php?topic=282250.0
  //  convert a double to string for printing
  char pp[7]; // setup character string for barometer reading
  dtostrf(Pressure, 4, 2, pp); // convert double to string
  Serial.print("Sea Level Barometer = ");
  Serial.print(pp);
  Serial.println(" hPa");

  Serial.print("Pressure (Meereshöhe) = ");
  Serial.print(bme.readPressure() / 100.0F);
  Serial.println(" hPa"); //1hPA = 1mbar

  Serial.print("Approx. Altitude = ");
  Serial.print(bme.readAltitude(SEALEVELPRESSURE_HPA));
  Serial.println(" m");

  Serial.print("Humidity = ");
  Serial.print(bme.readHumidity());
  Serial.println(" %");

  Serial.println();
}


// Keisan Calculation for Sea Level Pressure from current BME280 readings
// http://keisan.casio.com/exec/system/1224575267
float getP()
{   
  float k = .0065; // altitude multiplier
  volatile float z = (((k * altitude) / (bme.readTemperature() + (k * altitude) + 273.15))) ;
  volatile float y = (bme.readPressure());
  Pressure =   y * (pow ((1 - z) , -5.257)) ;
  Pressure = Pressure / 100.0F;
  return Pressure;
}


1 week shows average humidity per hour and not min/max. We actually implemented functions for the datastream many days ago. @Pavel maybe it is time to introduce them?

1 Like

Thanks! I found the info in the documentation.

This means that minimum chart update interval is 1 minute for 1h, 6h, 1d periods. 1 hour for 1w, 1m and 3m periods.

Do i have an option, to display not averaged values on the graph?

Nope.

why on earth would you want that? If you have 1m updates or even 1s udates and you select the 1y overview, how do you think the graph would look like? Graphs are meant to give you a general insight in what’s happening. If you also want to track extremes, then create a second data set where the max/min value per day is stored and you put that in a graph as well.

1 Like

@wolph42 well, it always better when you have 1 stream and change the view aggregation depending on your current needs. Otherwise you have to change code every time you decided to change something.

that’s true, but is that also possible? Say that I’ve been monitoring a hen house (don’t know where that came from) for humidity and temp for the past year and I want to check whether any extremes occured in that year. Can I access that data through blynk? Or could I make an extraction of e.g. max/min per day based on the data set/ Either in the code or through the app?

And yes I’m aware of the awesome report feature Blynk now has!! but i haven’t used it yet so I don’t know whether you can do with that that which I just described

Yes. (reporting widget)

Yes. AS long you do not post data faster than 1 value within 1 minute per device per datastream. Otherwise it will be averaged within 1 minute.

Not in the app yet.

yes, ok, but that means that this ‘extreme’ check needs to be done in excel (or somesuch) as the data is sent to your e-mail. Its not possible to access that data in your code, parse it and then show the result in the app?

Not at the moment.

ok thnx for the fast answers!

I can’t find any documentation about the report feature. I would like to know the functions before i buy it.

1 Like

The timeline of the graph should be expandable/stretch to see the values for the day.

Of course, the best thing would be to have a function for the max/min value per day which is stored on the blynk servers extracted from the main stream.

Sorry. Not yet ready. Very new widget (1.5 week only).

1 Like

In short: The resulting file is an archive (actually link to it), sent to your mailbox with .csv files for every Vpin requested, for a timespan required (last day, last week and last month to choose from). The basic difference between “three dots” and the reporting widget is the correct time stamp applied - in human readable format. One more: reports can be set to be created automatically in a repeatable manner.

1 Like

@hotinhere: are you aware that you can recycle the energy? So you can ‘buy’ the report widget and ‘sell’ it again at the same price!

1 Like

Thanks for the info! Sounds great.

@wolph42
No, i didn’t know that! Neat info :joy:. Thanks!

Hello.
Can you post the full code ?. I have a BME280 module and I want to use it in this way.
Thank you.

@Dmitriy @Pavel Still loving the platform and it’s working great - it would be excellent to have the option to graph the MAX or Last Values for each timeframe. :slight_smile:

1 Like