I am converting my app to Blynk V2.
I am using a superchart to show percentages, and I would like it to be fixed, from 0% to 50%, for instance.
I have tried a bunch of options, but the scale keeps changing according to the data values.
I would like to use the “bar graph”, but “line” or “area” would be ok.
iPhone 7 running iOS 15.5.1.
Thanks in advance
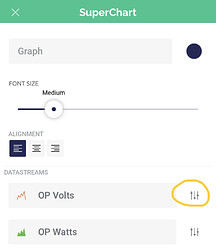
You click on the sliders at the side of your datastream…
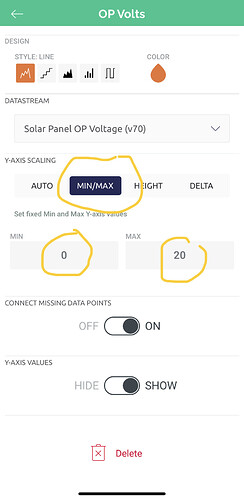
then select Min?Max for Y-Axis Scaling and input your min/max values…
Pete.
Pete, I did try that. Just to make sure, I was going to try it again after I read your post, but I do not have those options (though I think I did, at some point in time…???).
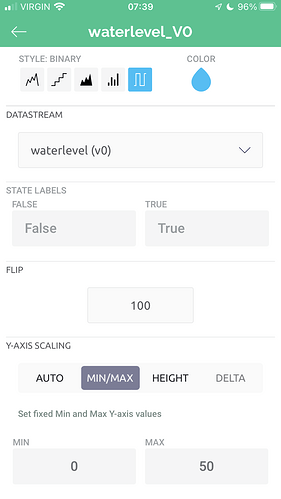
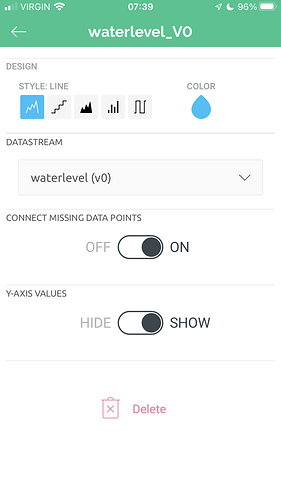
Attached are a couple of screen shots.
Note that the options you mention are available on the binary graph, but not on the line graph (or any other, for that matter)!
I just deleted the app and reinstalled, no change.
Looks like I may have found a bug… ?
Thank you for the suggestion!
How is your V0 datastream configured (data type, min/max values etc)?
Pete.
Screen shot below …
I think I found it: on the screen where you select the datastream, “override auto scaling…” must be OFF, then, on the datastream screen, I get the same as you posted. Looks like it is working now!
Thanks for the help, Pete, you nudged me in the right direction !
1 Like
