Hello, can you consider to add more datastreams to the App (ios & android) SuperChart widget. It will very usefull to provide a similar end-user experience between web dashboard and app.
I’m sure there are many use cases that will benefit from having more datasteams.
well… is clear that I need to do a better job at calling to your attention… but since the post is already there… any chance to add more datastreams to SuperChart widget?
The use case is an IOT device that protect a water pump to run under pressure conditions outside their limits… for example:
not water in the pump: the pressure on the pipe will be low, very low. The pump will burnout since it uses the water itself to cooldwn and also will spin faster than the operation design limits. IOT device should turn the pump off.
a valve in the pipe circuit is not working properly (remains close): the pressure on the pipe may go very high… danger! turn the pump off!
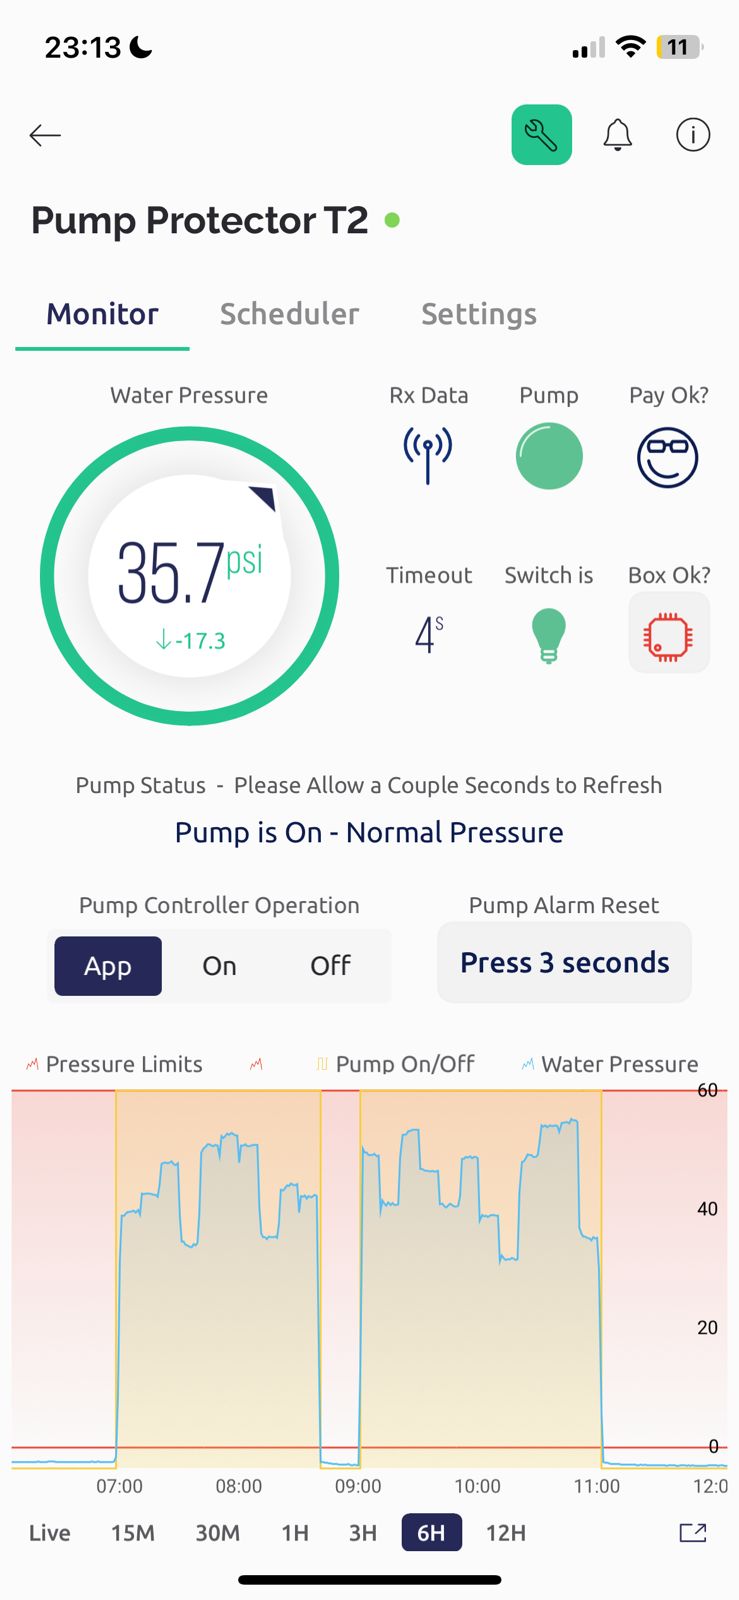
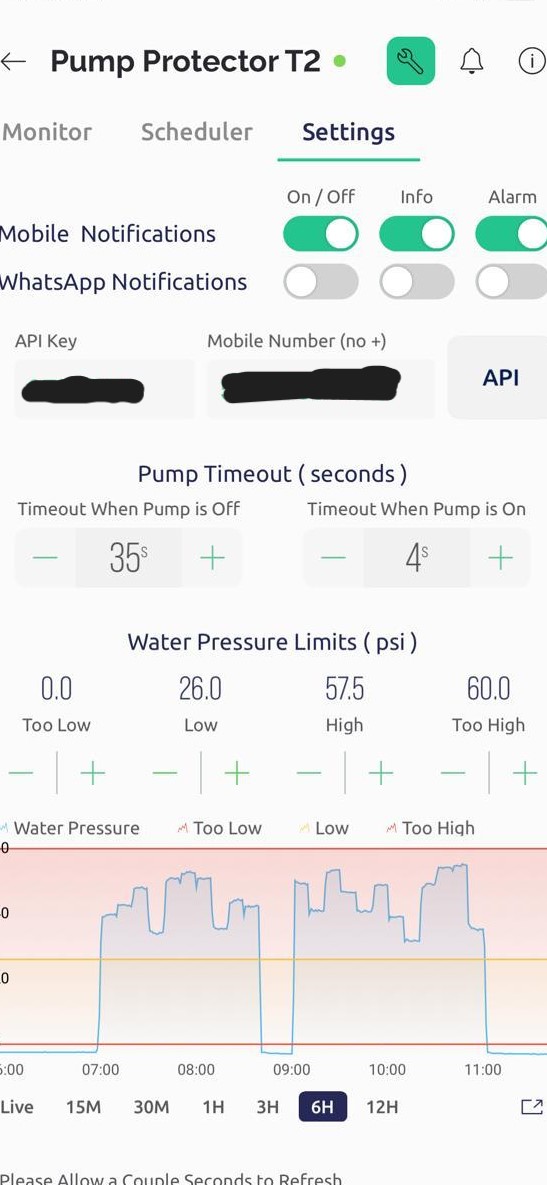
So, in the setting of the device you have 4 pressure limits: too low, low, high and too high pressure to adjust. This conditions of operations (pressure limits) are specifics to each installation, so you need to “calibrate” your IOT device to your specifc environment. In order to do this I have a tab in the app for the settings, in this case you need to learn the normal operarion of your pump and compared to the pressure limits and adjust the values. That means 5 datastream:
1.- Pipe Water Pressure
2.- Too low pressure limit
3.- Low pressure limt
4 .- High pressure limit
5 .- Too high pressure limit
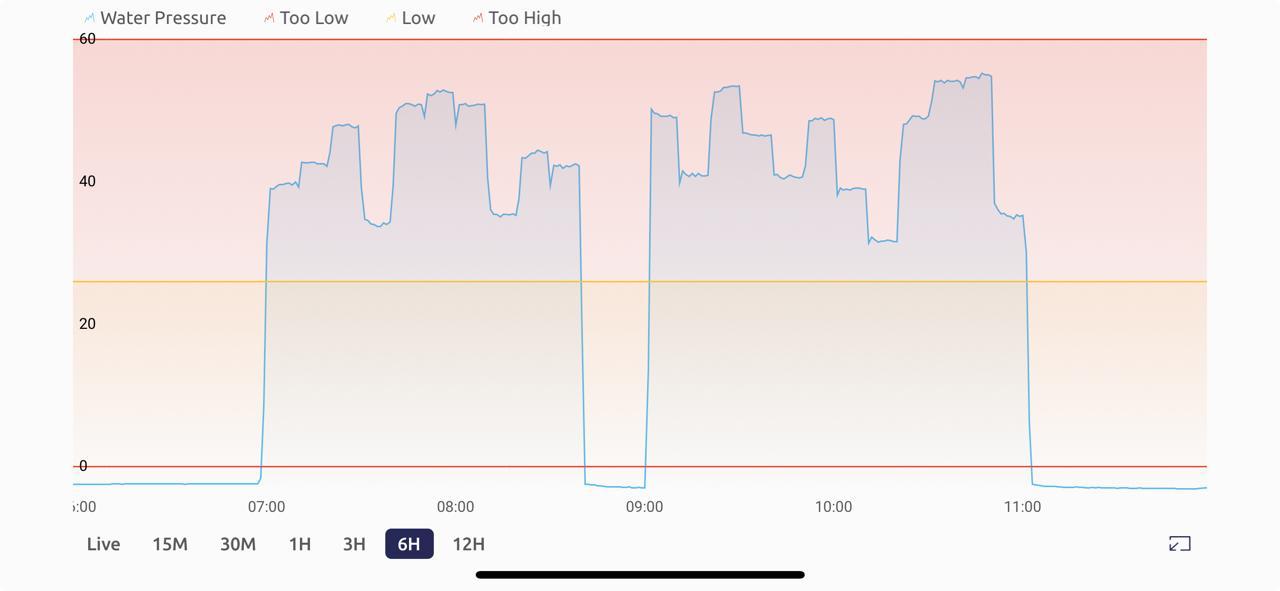
In this cases all 5 datastreams use the same y-axis scale: pressure in PSI.
As of today I can only show 4 datastream:
I have to say that I do find it rather anoying that the mobile app is limited to just 4 datastreams per Superchart (depending on your subscription of course) and the web console allows many more (I tried adding up to 10 and didn’t reach the limit.
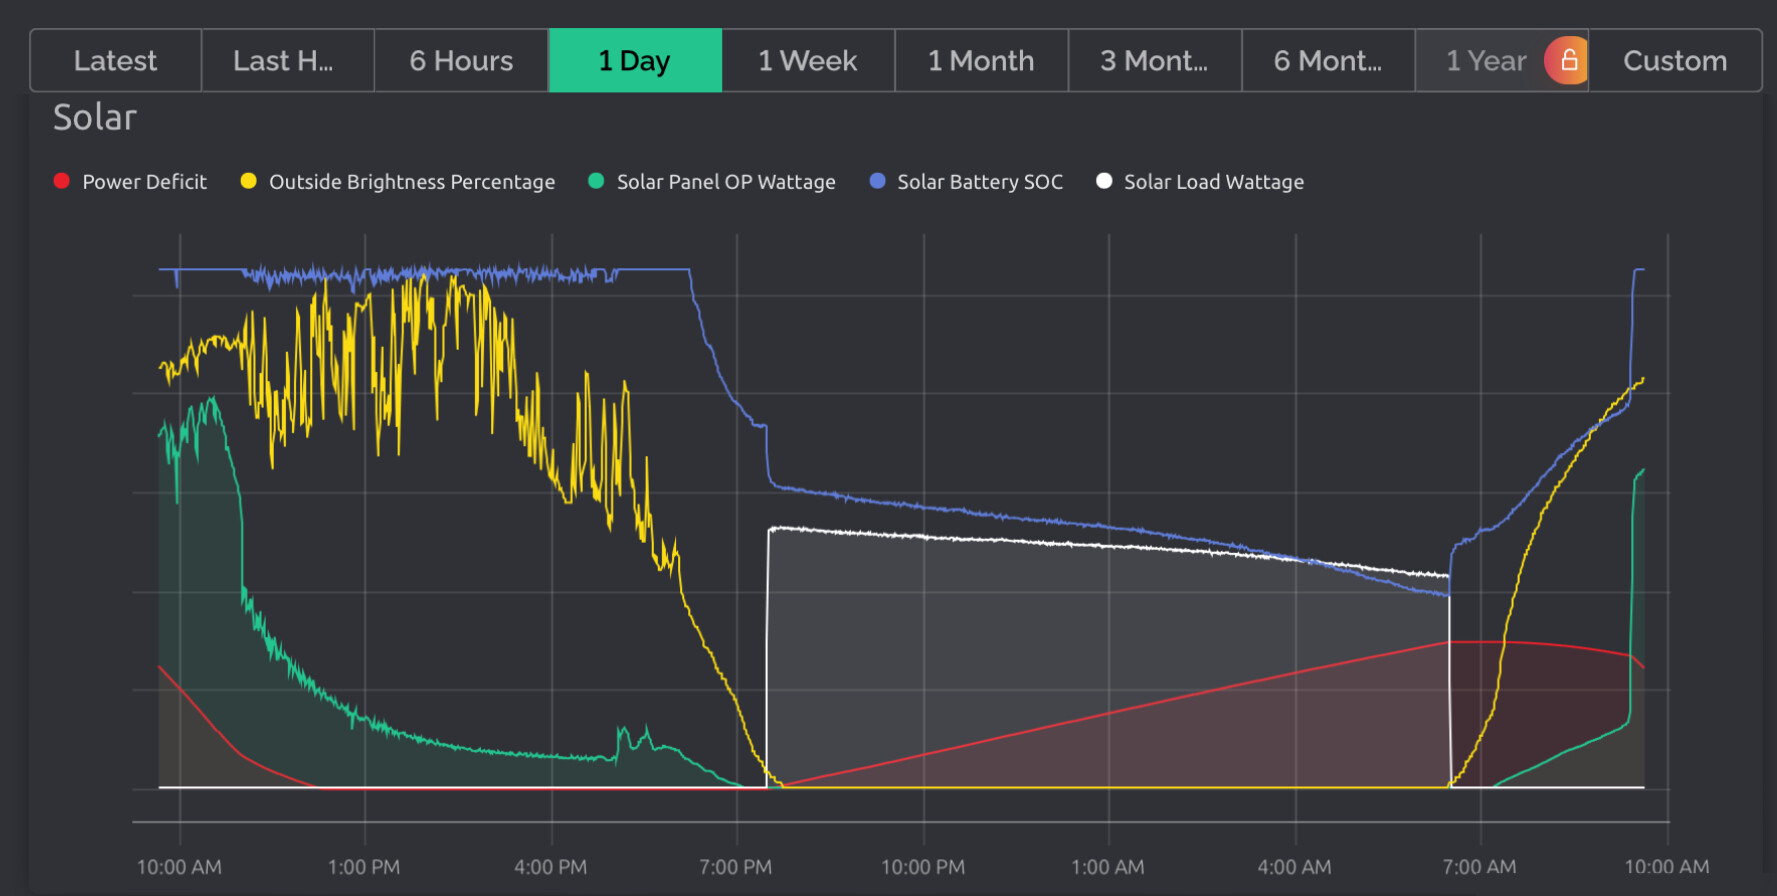
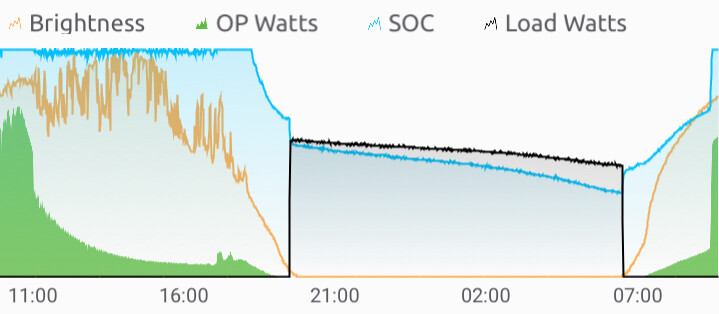
Personally, having 5 datastreams to measure my solar controller results works very well in the web console…
We don’t have plans to increase the number of datastreams without reconsidering the design overall.
It’s not the question of how many lines to render, it’s a question of how many Y-axes you can show. And without axes, there is no point in showing many datastreams as there will be no understanding of data scale (which leads to meaningless comparison)