I really like how clearly Gauges tells you the current state of the connected sensors. It would be great if we could have something like nested gauges (check attached pic) which can also tell the details on tap.
I made a live example here. See how you get the complete detail on mouse Hover but on mobile it can be on Tap.
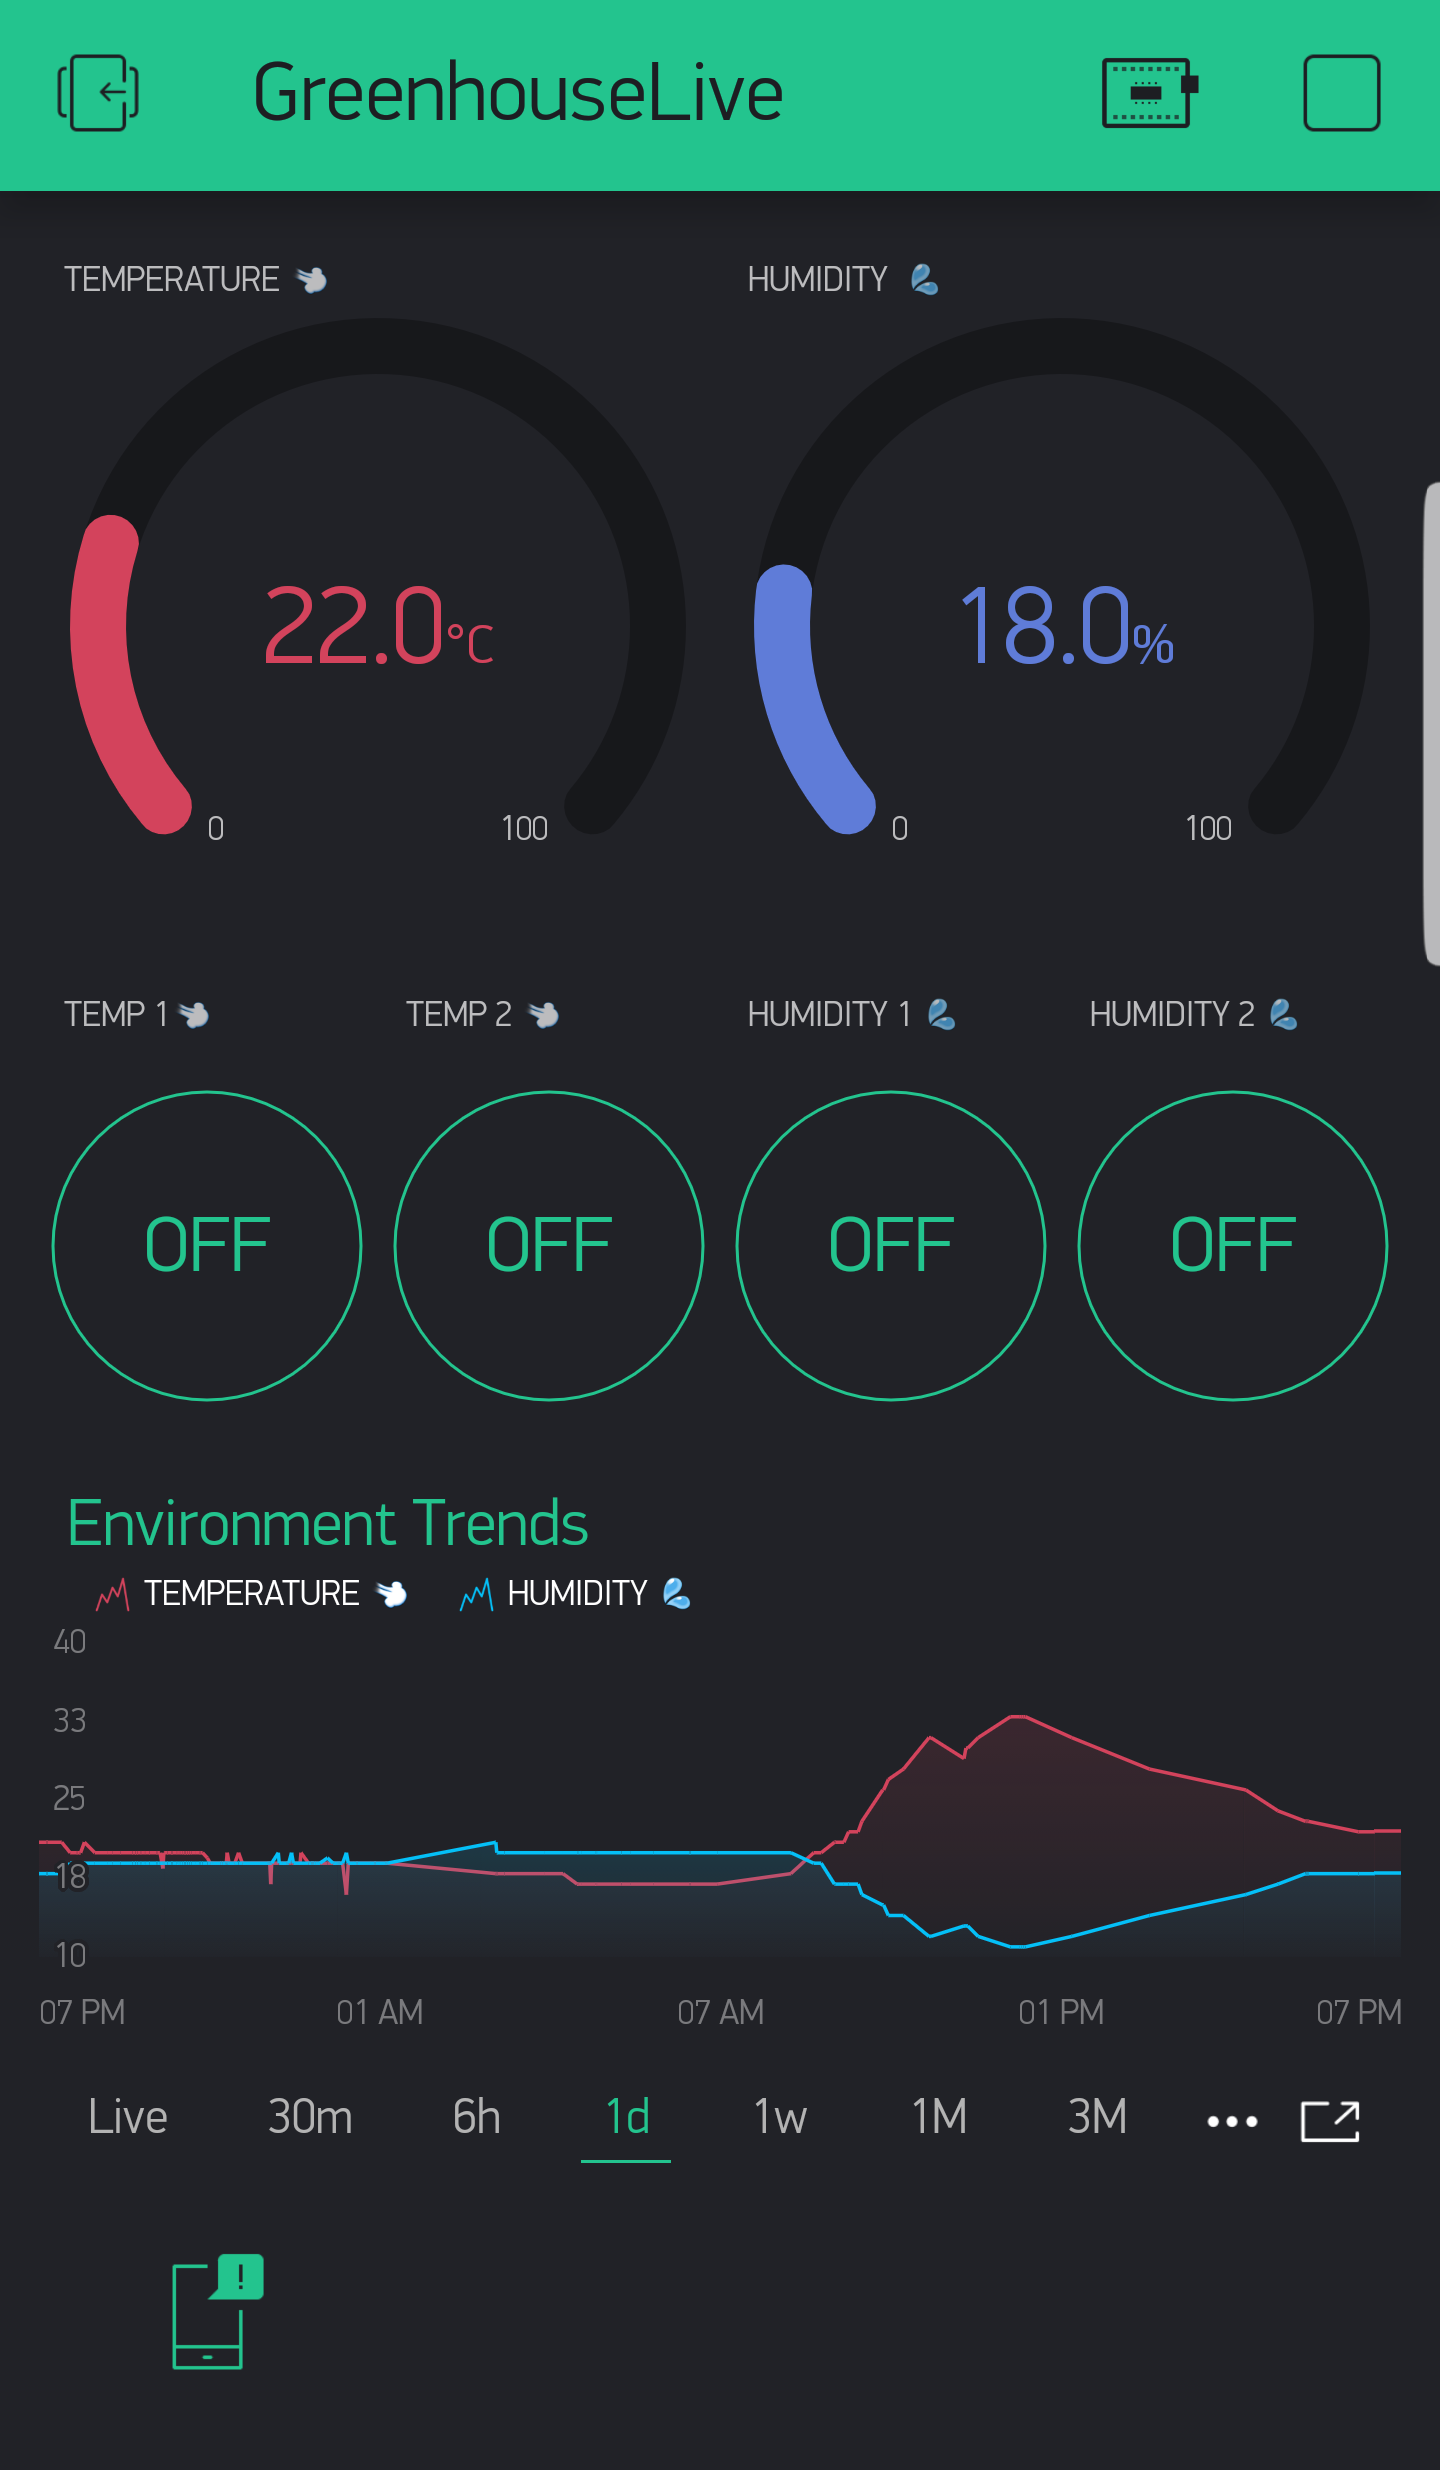
Below is my current setup, I want to add more values in Gauges but then, gauges on the whole screen won’t look good. So something like Super Gauge would be great.
It’s visually very pleasant, like it a lot, however such type of gauge only works for parameters of the same kind or for a “progress completion” (like on apple watch). Otherwise, unified scale won’t work. E.g. you can’t compare 0-100% humidity to -15 to 40 °C
Horizontal live bar chart would win any usability test here
Yeah you are right it would be best for progress completion like in apple watch. But what if we can define min max value for each circle/circular bar along with its own unit/prefix then it could be used for wide range of functions.
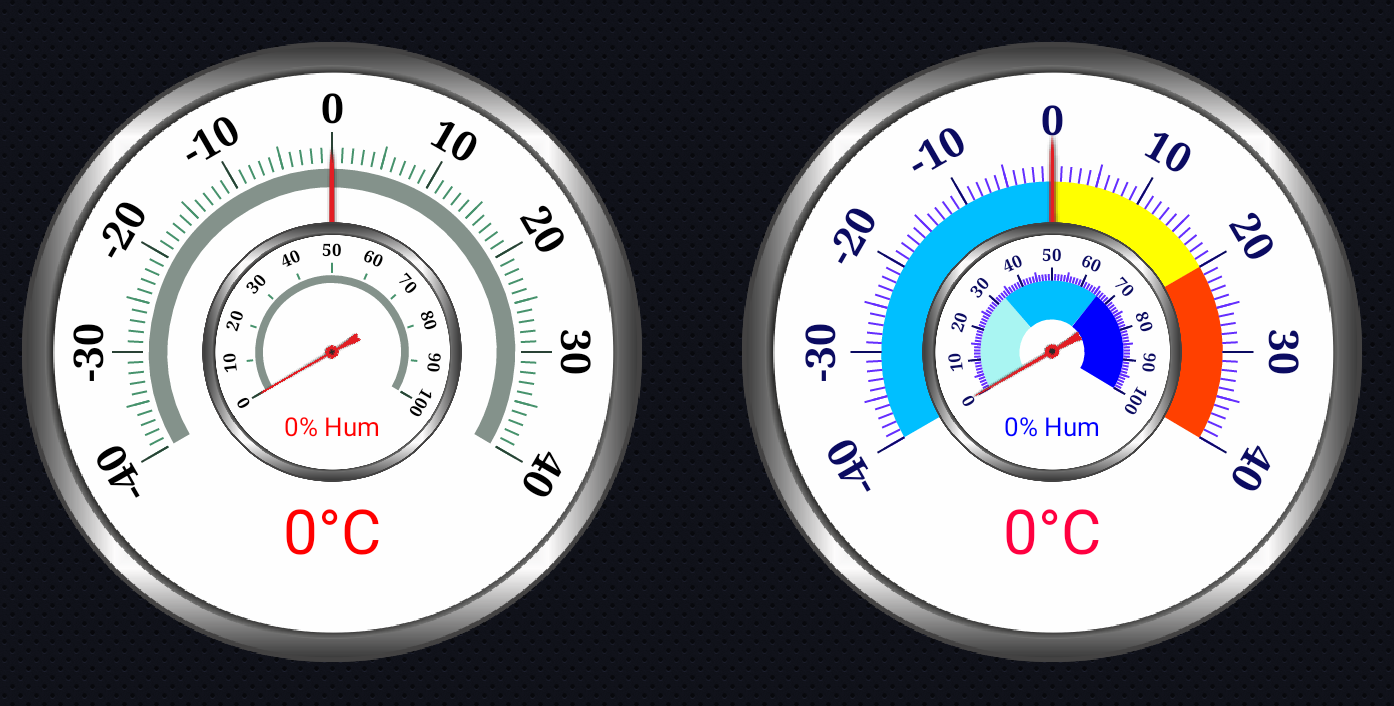
This is an example of two independent, but scaled and overlaid, displays using Virtuino, having something similar with Blynk widgets, using it’s more simple format but still independent & nested/overlaid as in the OP description, would be nice as well.