Hi,
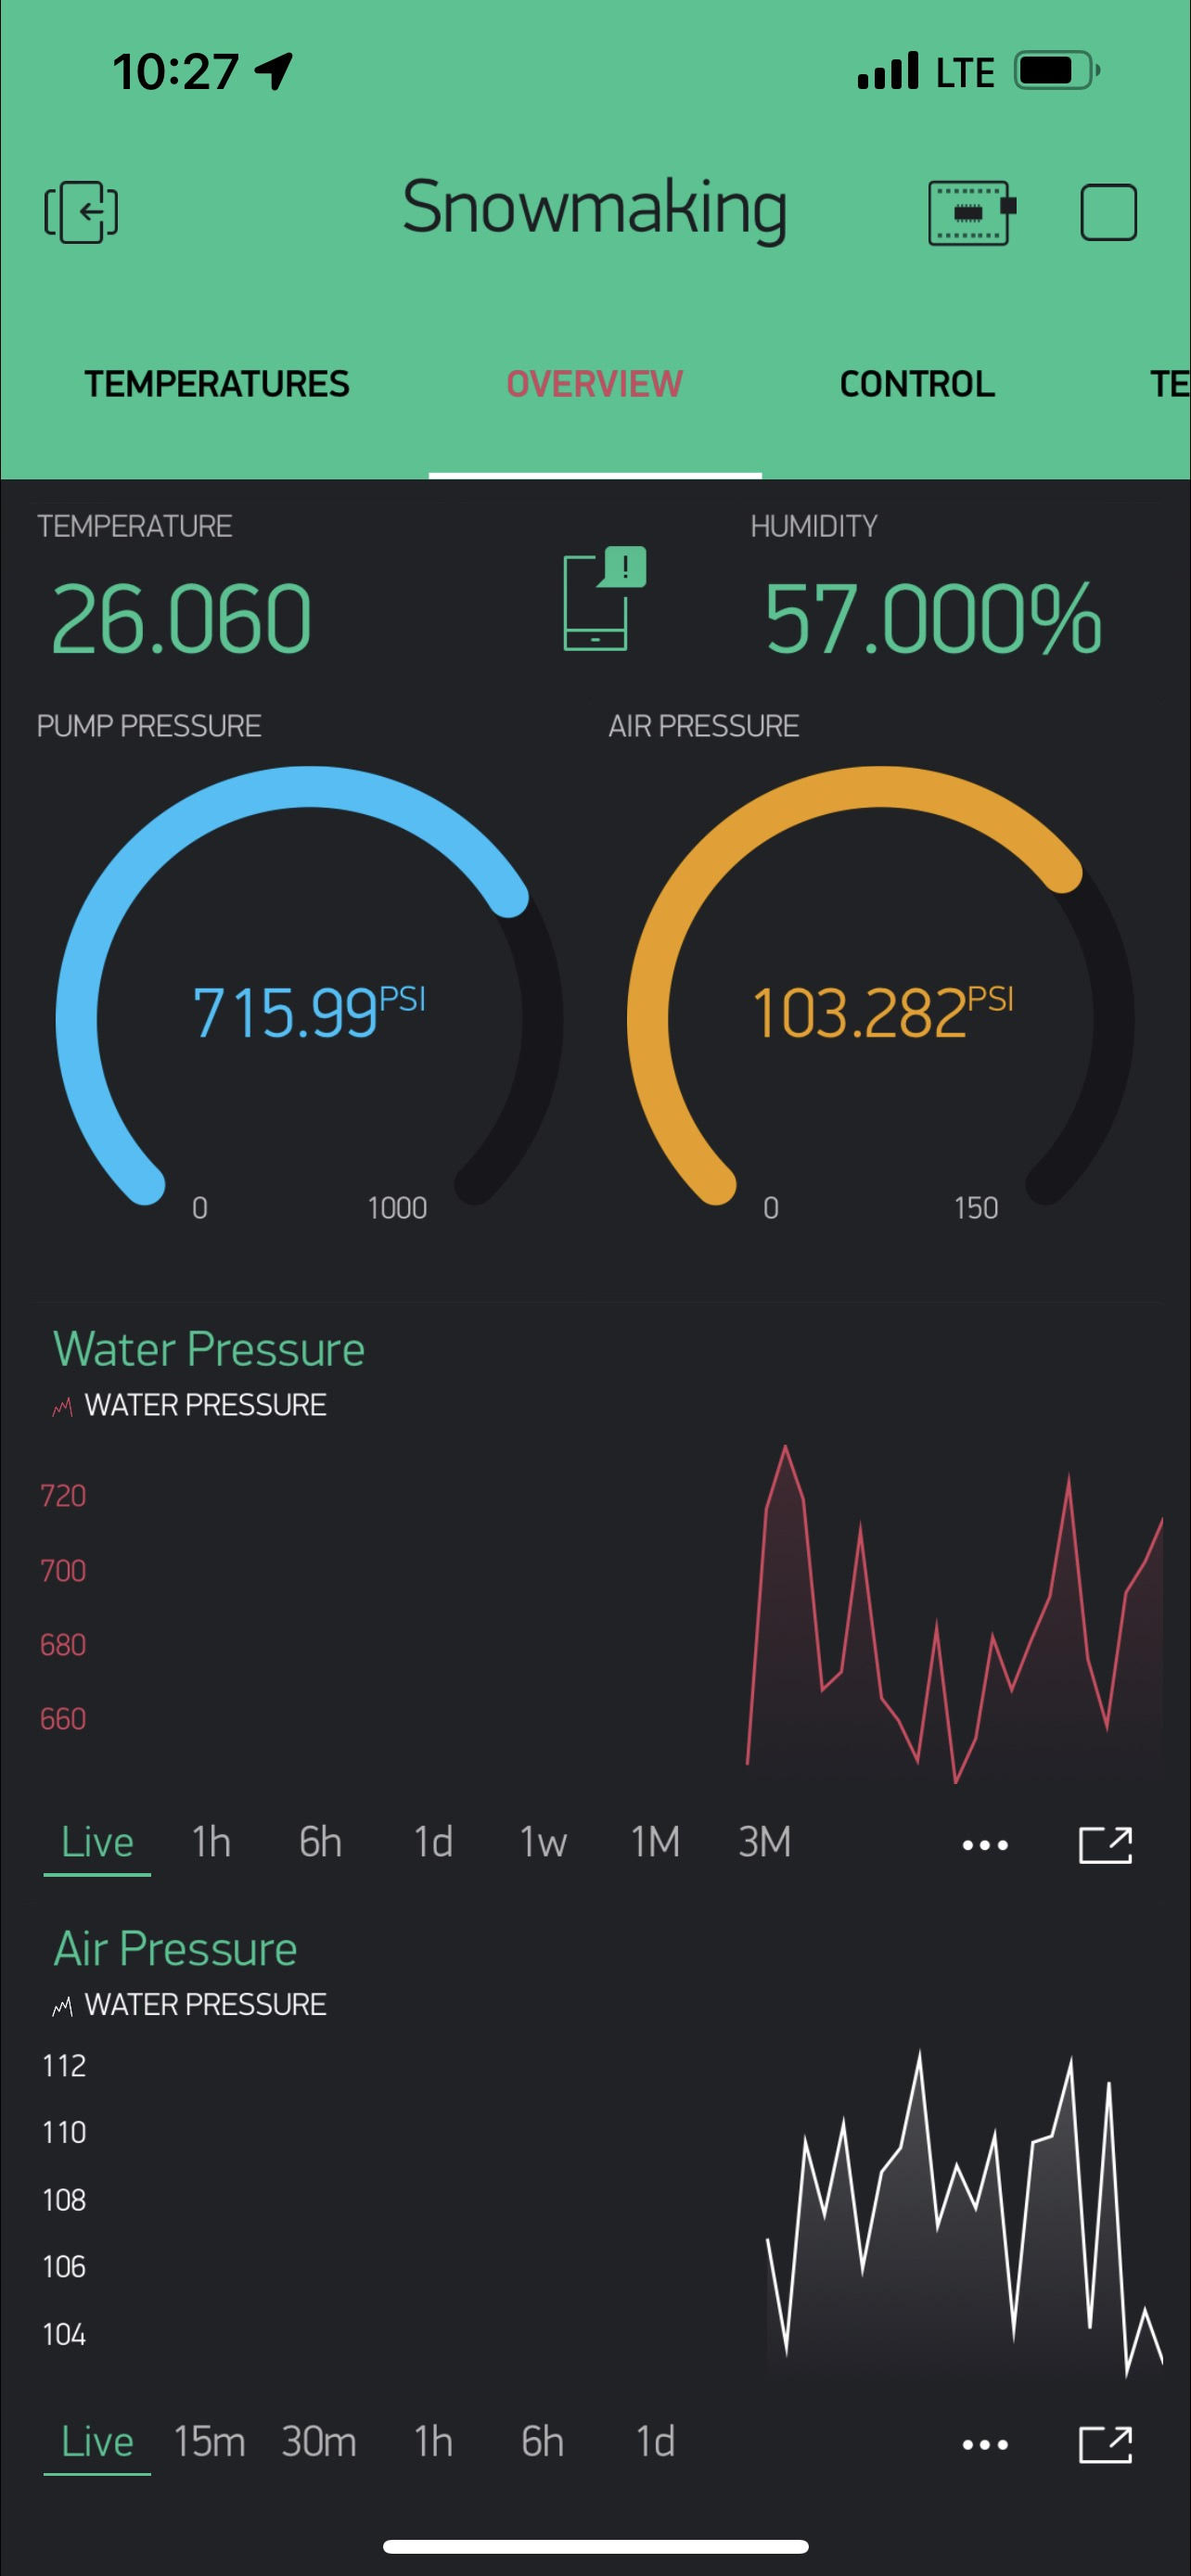
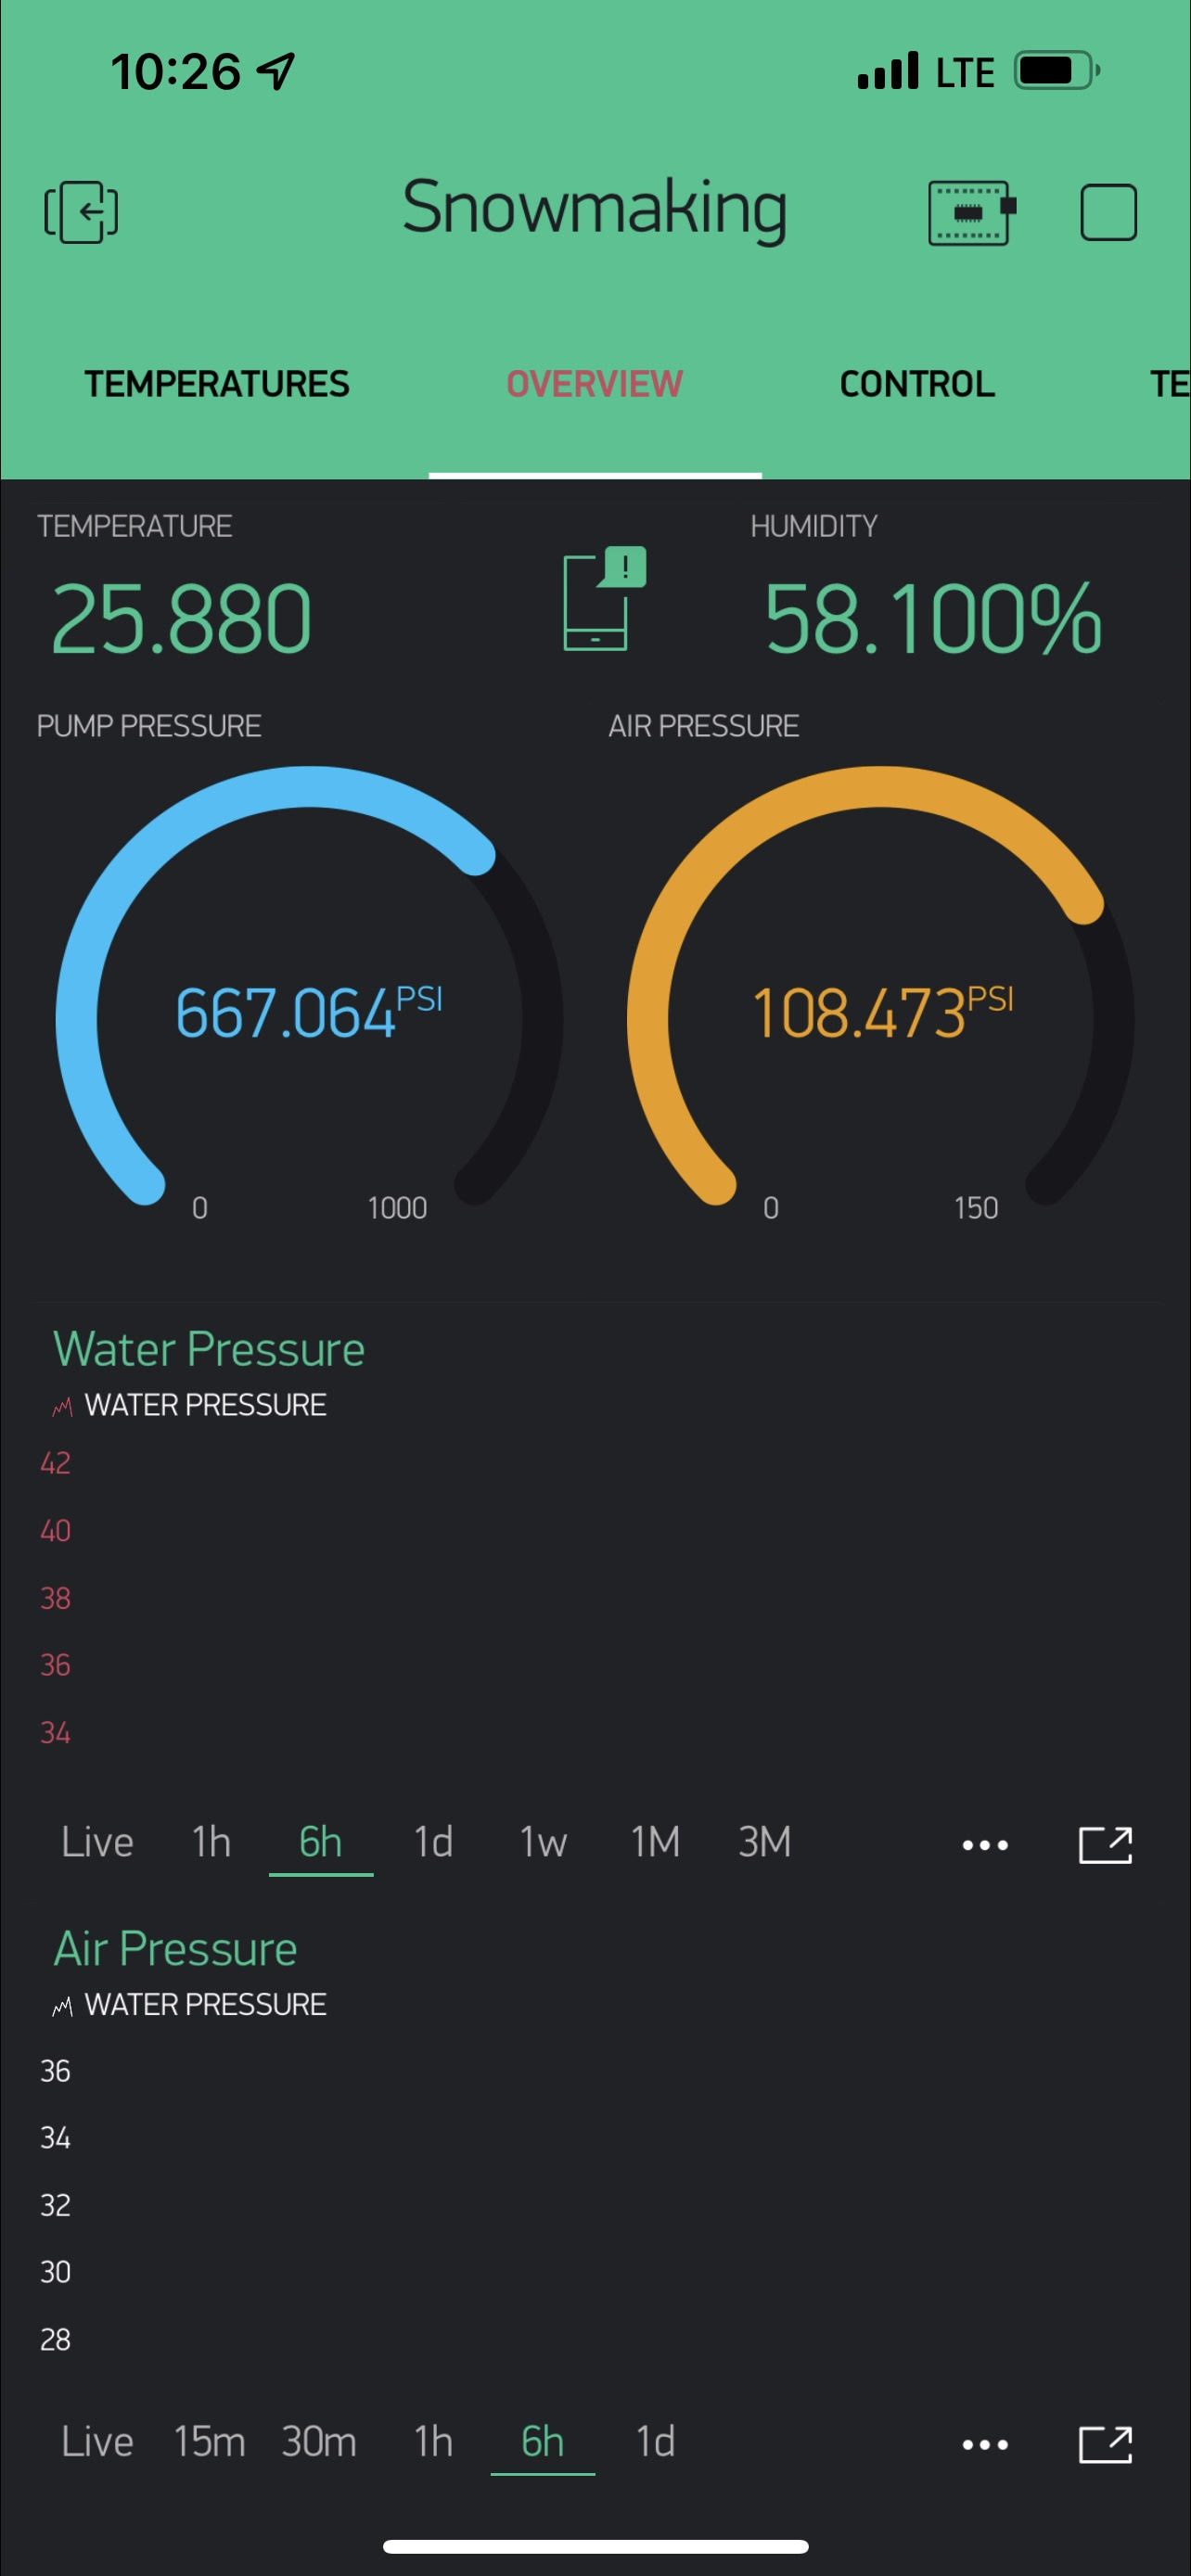
I need help with historical data on a superchart. I have two sensors updating code to blynk. I can view the live data but not the historical. When I change it to historical, it gives me a trend that shows much different numbers. See the trend, it should be around 650psi or so and its showing ±50 on the trend with no data.
See code below
 pressureValue = analogRead(pressureInput);
  pressureValue = ((pressureValue - pressureZero) * pressuretransducermaxPSI) / (pressureMax - pressureZero);

  Blynk.virtualWrite(V5, pressureValue, 1);

  pressureValue1 = analogRead(pressureInput1);
  pressureValue1 = ((pressureValue1 - pressureZero1) * pressuretransducermaxPSI1) / (pressureMax1 - pressureZero1);

  Blynk.virtualWrite(V6, pressureValue1, 1);