My Super Chart was working fine for months on my Blynk app.
2 weeks ago, there is nothing display on “1 hour” chart. After few days, the “6 hours” show no data . After few more days, the “1 day” chart show no data either.
I can still see the chart for 1 week with the last data on Monday, Oct 8th.
Yes, I can confirm that there is a data out for those pin as I can see the data with “value display”
Everything was working fine before and it just stop display the chart recently on 1hr, 6hr and 1day.
The 1 week, 1 Month or 3 Months are still working fine.
Hi there,
Key: did you find a solution for this problem.
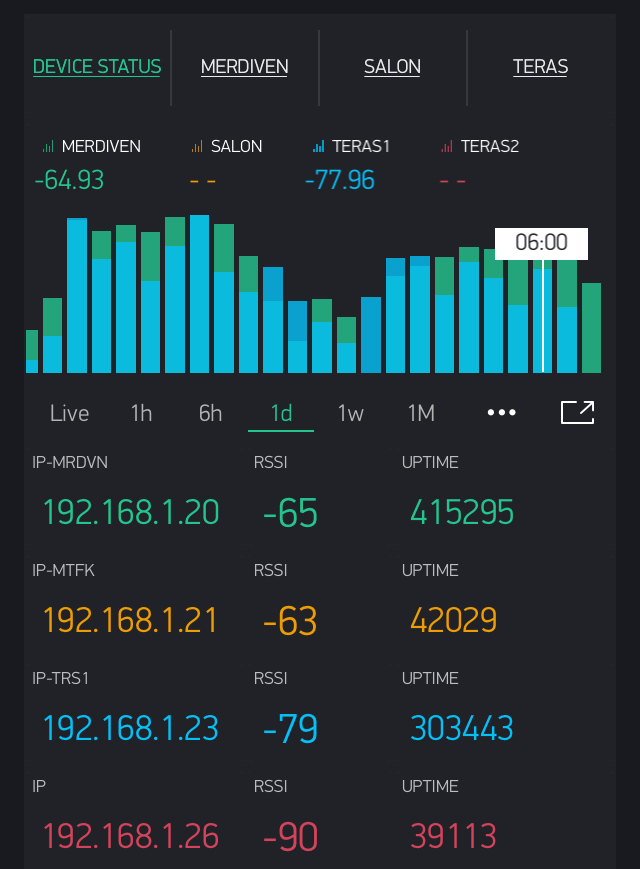
I have been using cloud server for a long time and I swtich my projects to local server. There are 4 devices at home. Superchart shows data from only 2. but when I turn on live view, I see data from 4 devices.
in another problem; If I choose something other than live or 1d view in the period section, it shows nothing.
Hardware : Raspberry pi3
Os : Raspbian
server : 0.39.12.java8
Platform : ios
Hi Dmitriy, do you see a problem with this coding ?. How can I check if the submitted information is in the proper format. As I mentioned earlier, the same information was not a problem when using the cloud server. I may be making a simple mistake because I’m not a software developer.
if (currentMillis - previousMillis1 >= interval1) {
previousMillis1 = currentMillis;
Blynk.virtualWrite(V50, WiFi.RSSI()); //Value display widget + Super Chart-1
Blynk.virtualWrite(V51, WiFi.localIP().toString()); //Value display widget
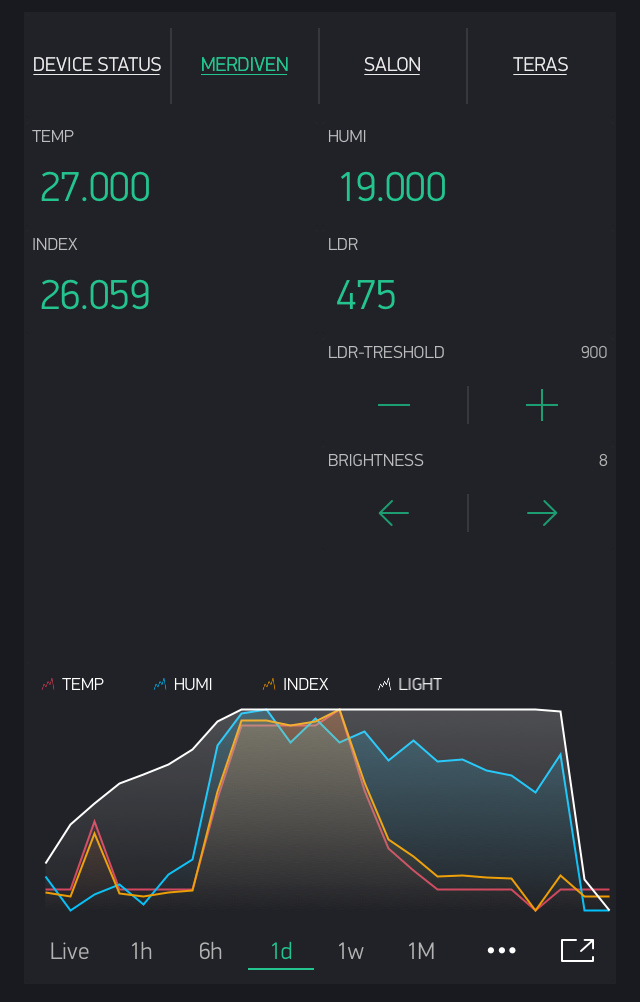
float h = dht.readHumidity();
float t = dht.readTemperature();
float f = dht.readTemperature(true);
if (isnan(h) || isnan(t) || isnan(f)) {
Serial.println("Failed to read from DHT sensor!");
return;
}
float hif = dht.computeHeatIndex(f, h);
float hic = dht.computeHeatIndex(t, h, false);
Blynk.virtualWrite(V0, t); //Value display widget + Super Chart-2
Blynk.virtualWrite(V1, h); //Value display widget + Super Chart-2
Blynk.virtualWrite(V2, hic); //Value display widget + Super Chart-2
}
Based on your screenshot, you are relying on the Graph to see your values… do you not have any standalone Display Widgets, of even the Terminal Widget or Serial.print() to show the actual sent values?
If you didn’t already have display widgets, then… yes?.. I have always understood the Superchart acts more as a repeater for the necessarily existing display widgets. Why it reportedly worked on cloud without them… who knows?