I have a question about Super Chart. I have used the widget in my app for displaying readings from distance sensor. For that i am using a data stream of integer (0-255).
In a ESP32 project i also use a int variable for reading the distance sensor data and publish data to blynk ever 1sec.
Blynk.virtualWrite(V2, avg_distance_cm);
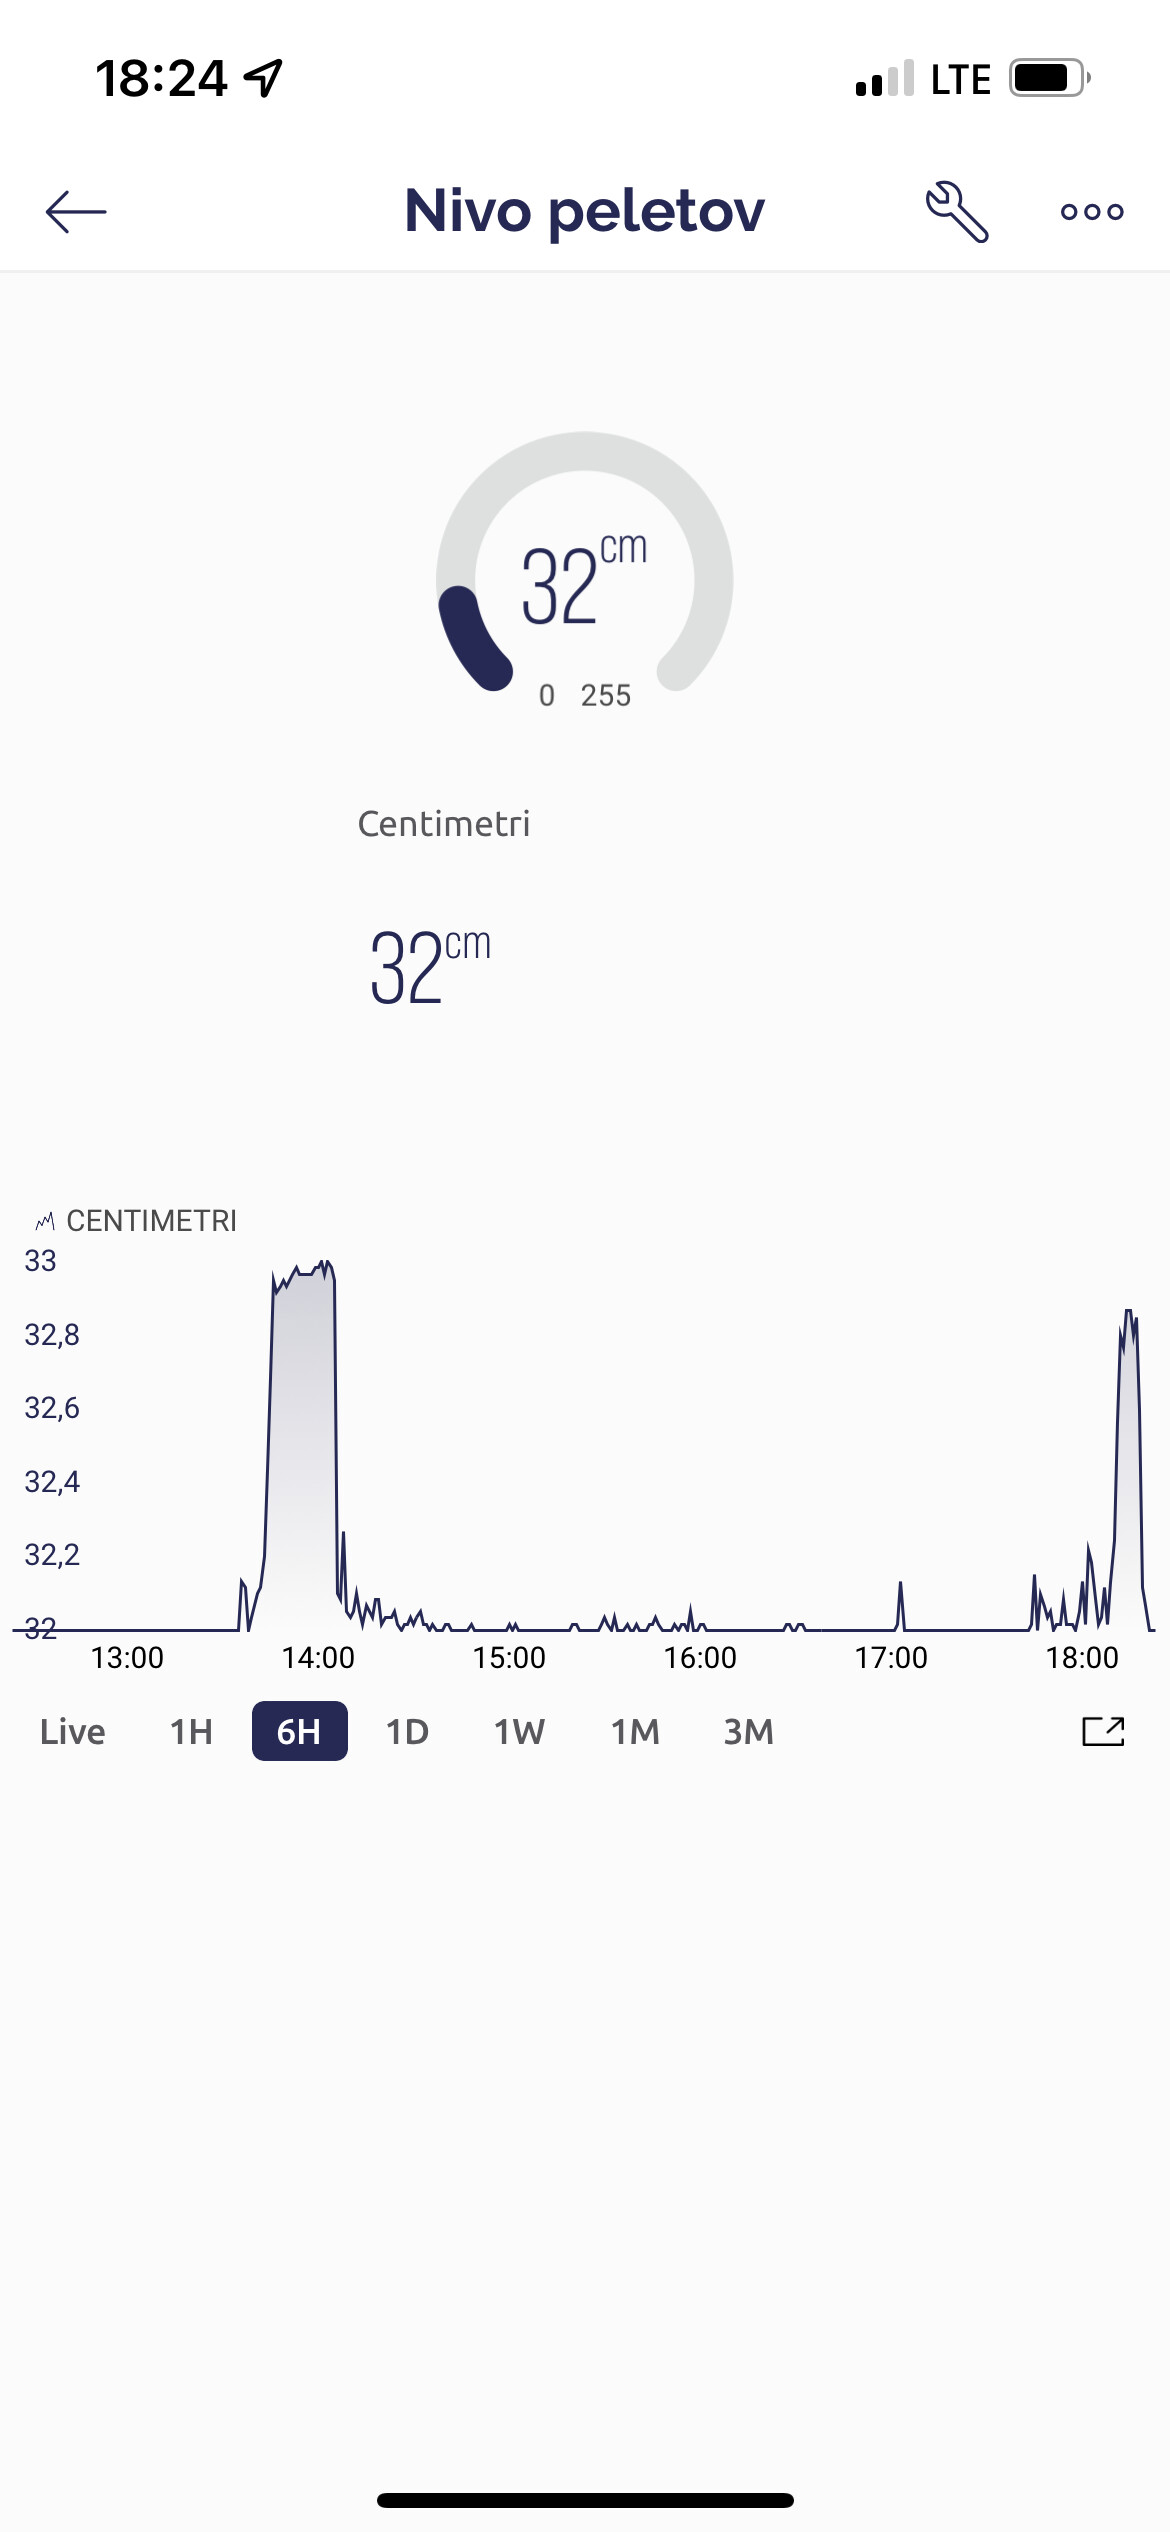
What is causing me problems is that a super chart is plotting a float data. How is this possible when i’m publishing int val to a data stream V2 which is also declared as int? i have a constatnt distance of 32cm for instance, but if i look at history data for last day on the chart it shows data randomly ranging from 32,0 - 32,8.
Are you 100% certain that a value of 32 has been sent every single second for a full 24 hour period (and that probably needs to be 00:00 hrs to 23:59 GMT) ?
So on the one hand you seem to be saying that you’ve pushed a constant value of 32 every second for a day, but not it’s just that you’ve been pushing data since Friday, and the Superchart screenshot shows that the values have varied over that time period.
Superchart shows averaged data, so if you send just ones and zeros, they will be averaged to 0.5 at times when equal number of 1 and 0 were sent for a particular time period.
But, unless you’re much clearer about the values that you are actually sending then it’s impossible to give a clearer answer than that.
It also depends on whether you have raw data turned on in your datastream, but once again, we need more actual information from you to be able to understand if this is a real issue or not.