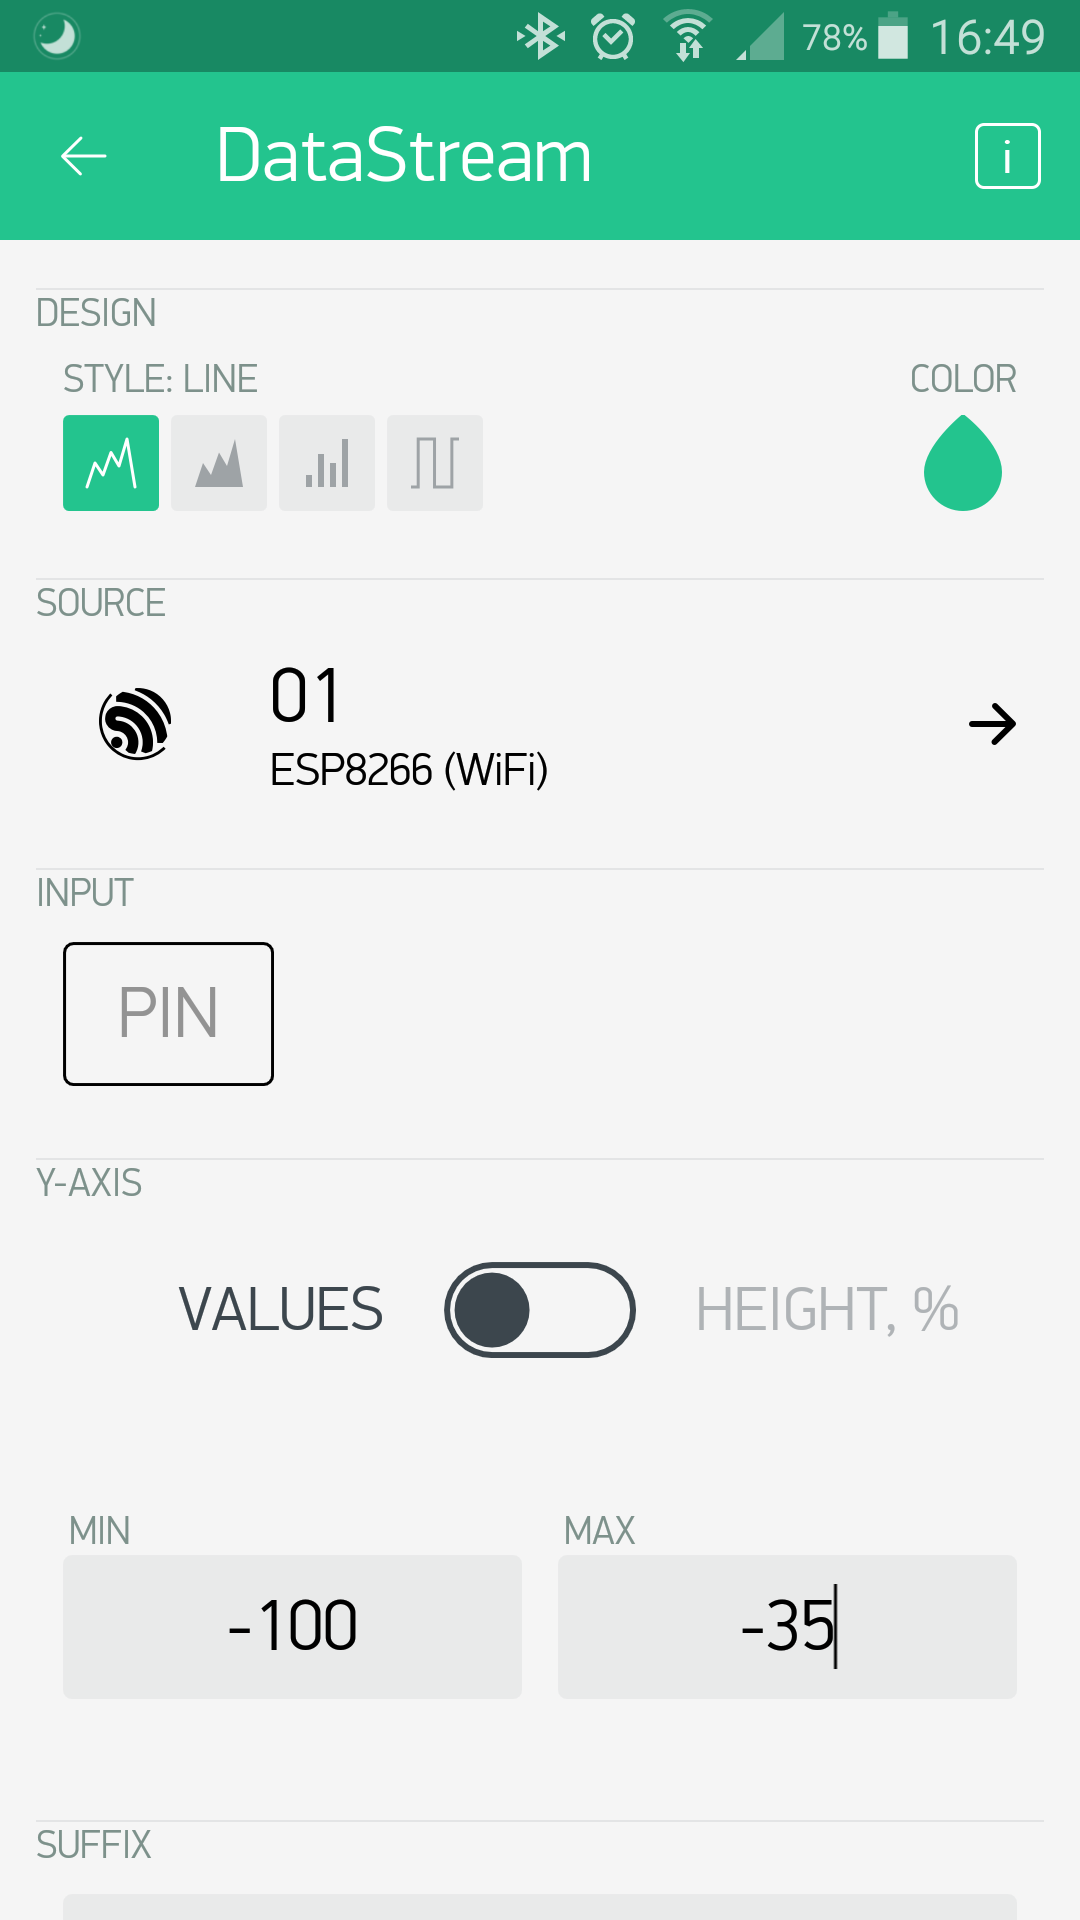
today i’ve tried to use super chart to display wifi dbm signal from multiple devices. i set the value min to -100 and max to -35 on all data streams. however, they continously keep resetting to min 0 and max 100.
Very strange, are they not saving for you or they are not working on the view? It’s correct behavior when y-axis is switched to height %, as it would change any less than 0 and large than 100 to 0, 100.
This is a 4 year old topic about the Legacy version of Blynk.
If you are using the new Blynk IoT version of Blynk and experiencing similar issues then I’d suggest that you create a new topic and provide all of the appropriate details, including details of how your datastreams are configured.