i need help with the superchart functions. I have a value which starts at 0 after start up and raises, it’s a watercount with a flowmeter. I send this rising value to a chart every second. in the live view i see the bargraph rising. So heres the problem:
When i choose a a wider range “day” or “week” it seems that blynk is performing an average of all values. But what i want is to take the latest value which has been sent and sum it over the choosen time resolution. The reference of super chart tells that there are functions available, but how exactly are they used? I couldn’t find an example.
I think that if you re-read the documentation you’ll see that the functions only apply to tags (where you’re aggregating data from multiple sources) and only work 8n live view.
For normal data streams you need to read the part about granularity, towards the end of the Superchart documentation.
If you’re sending one reading per second then these values are buffered and averaged over the period of one minute, and the result written to the database at the end of that minute.
This value is then used for the views up to and including 1 day (except live view of course).
Views greater than 1 day use records that are averaged over a 1 hour period.
This is how Superchart works, so you need to work with it to try to obtain the results you need.
Sending one record per minute, containing the value you want, will solve the problem for views upto one day.
Sending one record per hour (to a different virtual pin of course) would allow you to do time periods over 1 day, but you’d obviously need a different Superchart widget instance to display these.
perfect thank you. I think i can get it to work the way i want. I will send only one value per day to the cloud that way i should see how much water was spent per day. I will use a normal labeled value for the all time sum- get the latest virtual pin value from the cloud on start up and add the delta if delta >0 and send it back to a virtual pin.
There is another way.
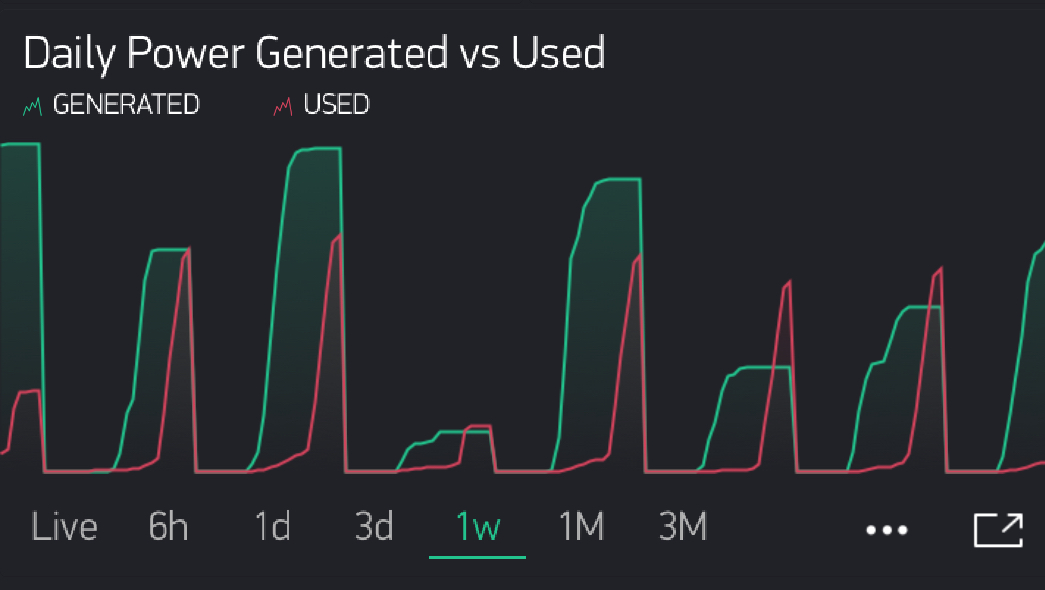
I have a small solar project at home and I record the cumulative energy produced through the day, and the energy used. I accumulate the values for both in my code, then send the current running totals to the Blynk cloud server once every minute.
At midnight I reset both values to zero…
The advantage of this system is that I can see the pattern of both energy production and usage throughout the day, and also see which was the highest at the end of the day.
Hi Bill, I use an Epever solar controller that has an RS-485 interface which is connected to a Wemos D1 Mini via a 435 to TTL converter.
The Epever gives panel output in KWh and load in KWh.
My process isn’t very scientific - I just query these values every 5 seconds and display the results, plus accumulating them into running totals for the day. The numbers don’t really mean anything, as they aren’t true KWh figures because they are 5 second snapshots and not then turned into hourly numbers, but they do give a really useful overview of power generated versus power used.
The Epever’s Panel output in KWh number is actually a representation of how much of the available power from the panel is being used to charge the battery. If the battery is at 100% and it’s bright sunshine the Panel Output number will be zero, or at least very low, because none of the available output power is being used by the battery or the load.
All of the load goes via the Epever’s Load output terminals, rather than directly from the battery, so that the controller can monitor the power used and report on it.
The RS-485 interface can also provide other metrics such as battery voltage, controller and battery temperature (with an external probe), battery State of Charge etc.
My setup is only used for garden lighting, so having proper metrics about exact wattage generated and used isn’t really important to me. I guess that if you were selling power back to the grid, or running an inverter for off-grid living then it would be a different issue. My goal was to understand the daily ‘balance sheet’ of power generated versus power used so that I can understand if I need to tweak the hours that the garden lights are on for each night - especially during northern hemisphere winters when the days are short and often cloudy and the nights are long.
I’m not on that scale! just a small solar panel to power ESP32 Wxr Stn . . . I have a mate who has a serious solar setup, has just retired and is getting into Arduino . . . I’ll pass this on!