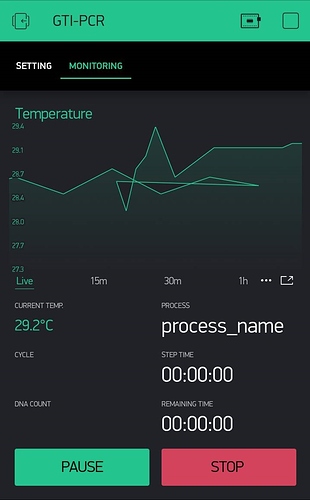
Hi, I’m facing strange behavior while pushing data to superchart. It’s look likes the data plotted in not ordered timestamp, creating chart like the image below. Sometimes it just plot it in random x-axis and sometimes it just showing flat line across the graph. The value seems fine in another widget though.
Here is my code:
#define BLYNK_PRINT Serial
#define ONEWIRE_PIN 32

#include <WiFi.h>
#include <BlynkSimpleEsp32.h>
#include <OneWire.h>
#include <DallasTemperature.h>

OneWire oneWire(ONEWIRE_PIN);
DallasTemperature DS18B20(&oneWire);
DeviceAddress sensor0={0x28,0x02,0x00,0x07,0x73,0x49,0x01,0x8A};
BlynkTimer timer;

const char auth[]="xxx";
const char ssid[]="xxx";
const char pass[]="xxx";
const char server[]="xxx.xxx.xxx.xxx";
const int port=8081;

void setup() {
  Serial.begin(9600);
  DS18B20.begin();
  DS18B20.setResolution(sensor0,12);

  ServerBegin();
  timer.setInterval(200L,refresh);
}

void loop() {
  if(Blynk.connected()) {
    Blynk.run();
    timer.run();
  }
  else {
    ServerBegin();
  }
}

void ServerBegin() {
  unsigned long now=millis();;

  //Connection to WiFi
  WiFi.begin(ssid,pass);
  while(WiFi.status()!=WL_CONNECTED && millis()-now<10000UL) {
    delay(1000);
  }
  if(WiFi.status()==WL_CONNECTED) {
    //WiFi connected message
  }
  else {
    //Connection failed message
    WiFi.disconnect();
    return;
  }

  //Connection to Blynk server
  Blynk.config(auth,server,port);
  Blynk.connect(1000);
  if(Blynk.connected()) {
    //Server connected message
  }
  else {
    //Connection failed message
    return;
  }

  //Connection success
}

void refresh() {
  DS18B20.requestTemperatures();
  float val=DS18B20.getTempC(sensor0);

  Blynk.virtualWrite(V12,val); //Push data to superchart widget
  Blynk.virtualWrite(V13,val); //Push data to labeled value widget
}

BLYNK_CONNECTED() {
  //Load all set value when connected
  Blynk.syncAll();
}
Screenshot:
I’m running this project on ESP32 using Blynk library v0.6.1 connected to local server v0.41.10 on Windows 10. I wonder why this happen? Is it because something in server side where data stored? or connection issue? I haven’t tested it on blynk server yet though.

