Hi all,
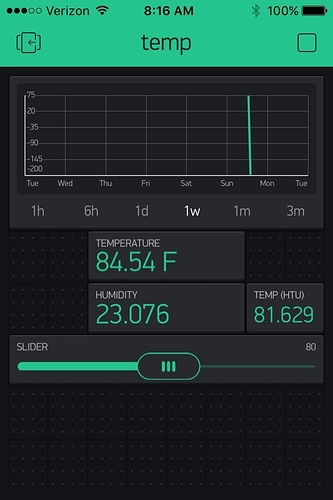
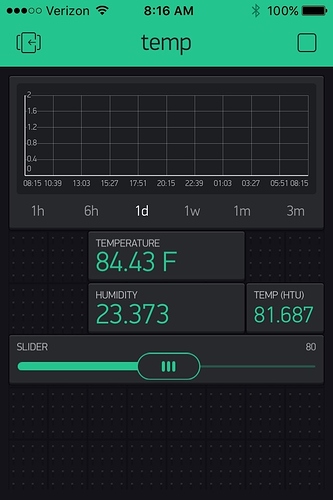
I’m trying to simply plot temperature and humidity on the history graph, but the y-axis is autoscaling to only show the humidity (cutting off temp). The y-axis is only 32-36 ish. The data is coming in fine from the sensors.
Is there a way to force it to show 0-100 for the history graph? It seems this is possible for the normal graph but I like the history aspect.
Now, actually, I have removed the humidity sensor Virtual input and it won’t autoscale to the temp at all…
Any help is appreciated!
Hello. Is that iOS or Android? Could you please attach screenshots?
I am running IOS 9.3.5 on an iphone.
The y-axis for 1h and 6h is the same as 1d. 1m and 3m only go from 74-76. (and the slider isn’t hooked up to anything yet)
I also tried deleting the widget and re-adding it, no change. Ideally I’d like it to go from 0-100 to show temp and humidity on the same graph, but for now I can’t see anything. I have another blynk program that uses the history graph for tracking temp and it’s always been fine.
Do I need to upgrade something, maybe? I have Blynk 0.3.7 on my arduino IDE and every other project is working great.
Thanks for the help
Oh crap, my bad, just figured it out. I had passed the temperature value as a string and the humidity is obviously a number. That’s why it wasn’t coming through. Sorry for that! Works great now.
I’ll write up my final ‘blynkubator’ when it’s all done.
Thanks for the great work you guys do!
Nice. Good to know it is not a bug 

