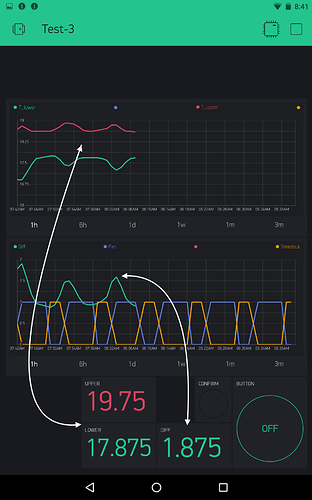
Half an hour ago my fan-controller’s history graph data ended, yet the controller continues to operate correctly and is still sending data. The value-meters for the same data are continuing to update correctly. Two other data continue to update and scroll on the history graph. It is just the history traces for those three data that have stopped. How can this happen? Blynk 2.8.1 for Android - here is an annotated screenshot of the app display:
What is login email?
Nothing suspicious. Are you sure issue is not with your hardware, code, setup?
I have not connected a computer to the board this morning. But the really strange part is that the same data continues to update the value meters correctly (I’m checking it against a display on the project board). Since the value meters are updating, how can the history graphs of the same data (same VPins) not update? I’ll try resetting the board, anyway.
What about 6h, 1d - same situation?
(Board reset)
As before, the value meters continue to update as expected, and the history graphs continue to scroll but without those three data. If I reported the data separately to the value meters and the graphcs, I’d know where to look for missing data, but I don’t. I’m sending three values to three VPins, and each VPin goes to two Blynk-app displays yet the displays differ. That doesn’t seem possible.
Yes, same situation on all three scales. The temperature data ceases at ~ 9:15 EST/14:15Z.
Edit: Ceased on the history graph only.
The temperature data is text strings: " 12.3456". They are room temperatures in degC, between 15 and 22, typically. The Diff data (VPin 3) is in the range -2.0 - +2.5.
I cleared both history graphs about an hour ago as a test. I also edited both history graph widgets, altering and then restoring their VPin settings. The temperature data still updates correctly on the value meters but not in the history graphs.
Since I cleared the graphs, the VPin 4 & 5 curves (blue & yellow on the screenshot) have been plotting as .5 or 1, and 0 or .5, respectively. Both of them are bools and sent as integers.
@JRobert good news - I found reason. You are sending values like " 19.1875" (space before number). We changed recently logic on sever side. So now such “strings” are not accepted for history graph. You have to change your code and send exactly number. Without any spaces.
This was done due to performance reasons.
Thank you for that, Dimitriy!
I was just now testing a simple program based on a Blynk Example progrm to send pre-initialized number strings in my same format and found the same behavior. So I dropping the leading space and that fixed it. I’ll push the fix to my project.
