Hii all. I am working on a few sensor values obtained from DHT 11 and MQ 135 sensors and can see the readings obtained from virtual pins on my android through the Blynk cloud. But how can I record or store the set of data for a certain interval of time in Blynk app when my microcontroller will be powered on? I need to retrieve the values obtained preferably in csv file format. Help guys.
Courtesy of those pesky documentation pages that was recommended you read before posting 
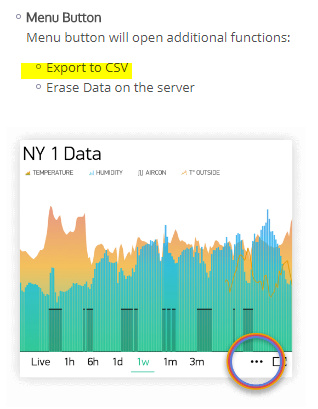
SuperChart and CSV export… from there you can analyze the data however you want.
http://docs.blynk.cc/#widgets-displays-superchart
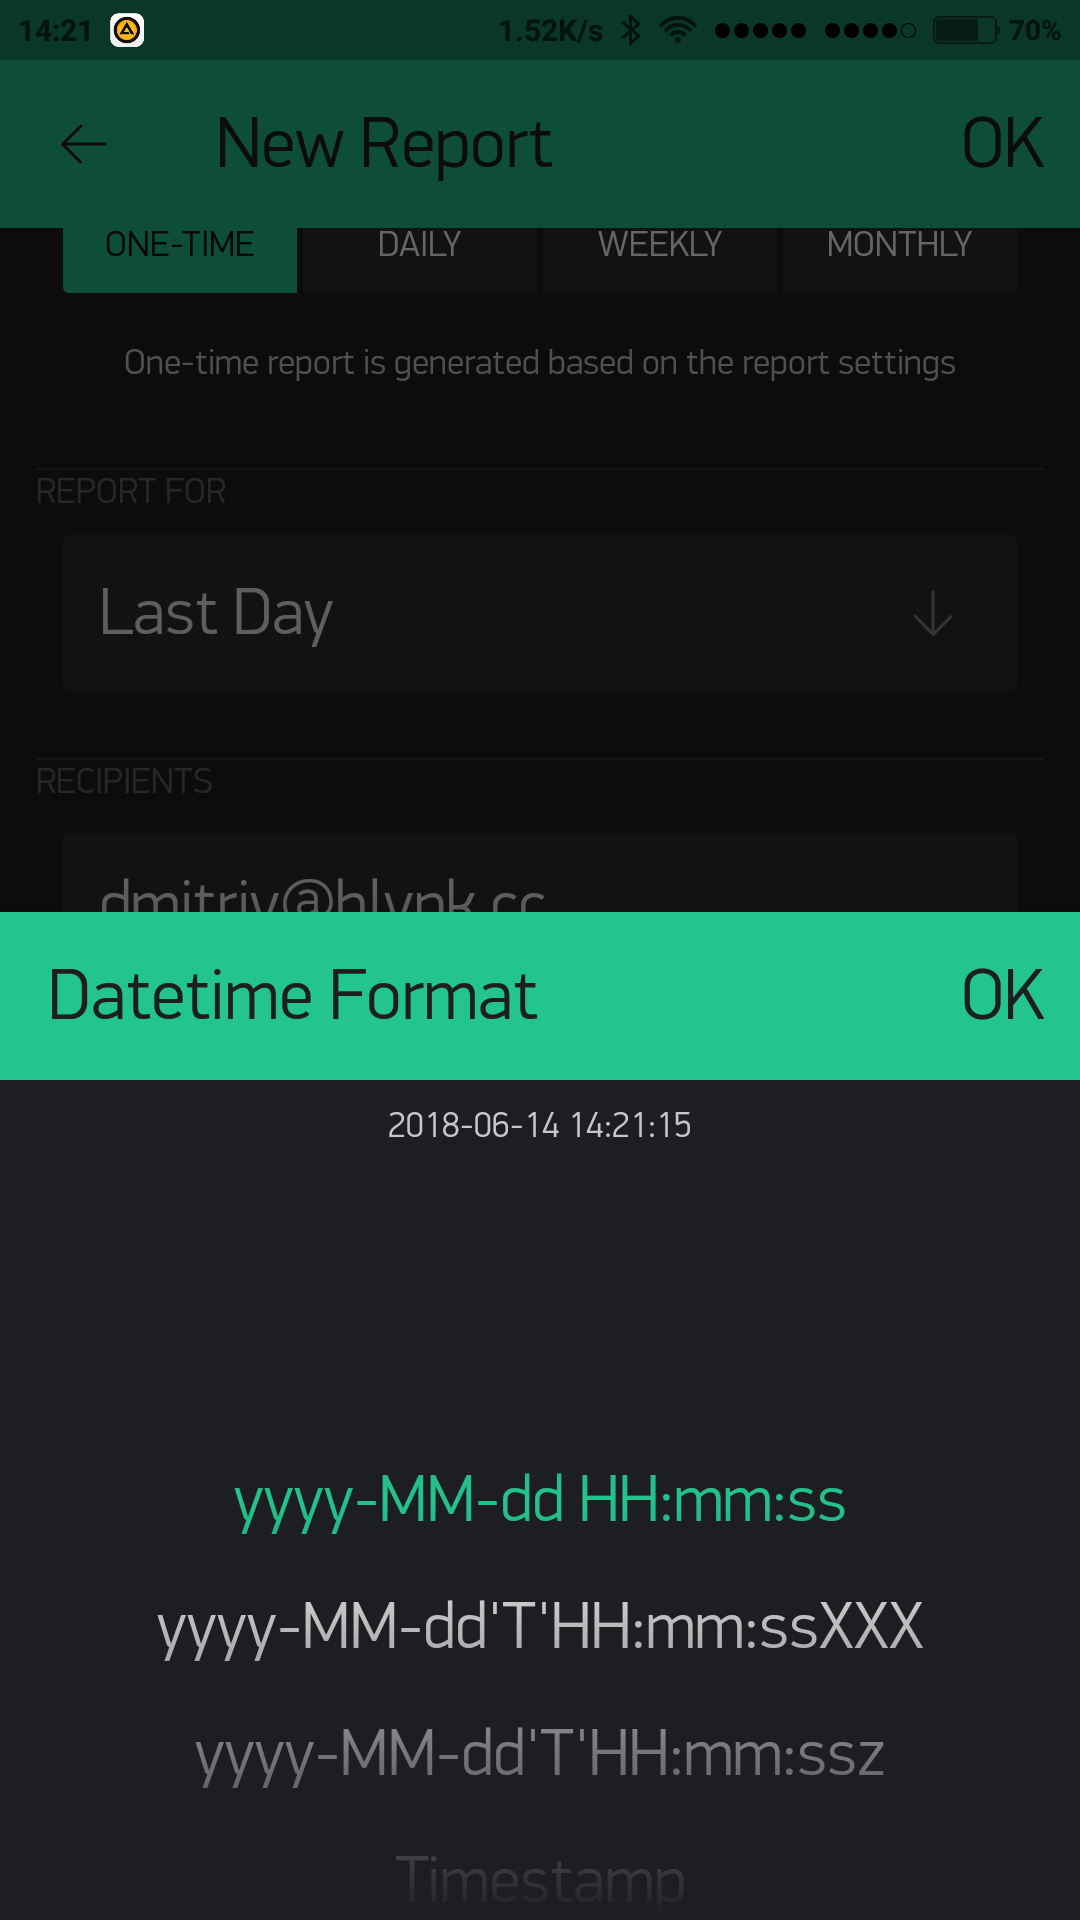
Thanks for your reply @Gunner but in the excel sheet apart from physical values abnormally large metric values such as 1.25E+12 are also getting printed. Way out?
Hey, really well done! ![]() Now the (MY) problem is: I’m not using device tiles…
Now the (MY) problem is: I’m not using device tiles…
Oh right… I am not a tile user, my attempts so far have left me unimpressed, so I was unfamiliar with that new reporting option.