I’ve been trying to use the graph to track the ON/OFF state of four relays. The one in tan, labeled “pump,” is set HIGH for only a few minutes at a time. It appears correctly in the 12hr graph as a short spike. However, when I change the scale to 1 day (or longer), the OFF states disappear, and the pump appears to be continuously ON.
I actually expected the opposite behavior - that the short ON times would not last long enough to show up at all on these longer time scales, and that the pump would appear to always be off. I’ve tried turning off the “connect missing data points” toggle, with the assumption that the graph would show individual events, but that eliminated the pump data entirely. Thoughts?
@PeteKnight That’s correct. The first screen shot is 12h duration, and the short spikes of the pump relay are as expected. The second screen shot includes the same data (~the last 40% of the Y-axis), but is a 1d duration. In this one, the short ON/OFF cycles is rendered as one long continuous ON block, and the longer OFF periods have been omitted.
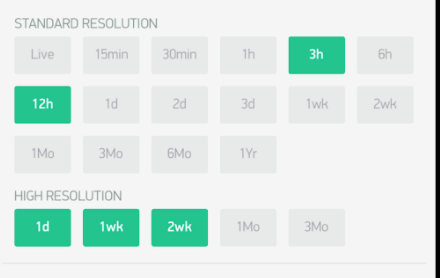
Time ranges picker Allows you to select required periods ( 15m , 30m , 1h , 3h , …) and resolution for your chart. Resolution defines how precise your data is. Right now chart supports 2 types of resolution standard and high . Resolution also depends on the selected period. For example, standard resolution for 1d means you’ll get 24 points per day (1 per hour), with high resolution you’ll get for 1d 1440 points per day (1 per minute).
Superchart supports currently 2 types of granularity:
Minute granularity - 1h , 6h , 1d ;
Hour granularity - 1w , 1m , 3m ;
This means that minimum chart update interval is 1 minute for 1h , 6h , 1d periods. 1 hour for 1w , 1m and 3m periods. … in case you send your data more frequently your values will be averaged
I don’t know, but it looks like this part of SuperChart doc is not updated
@PeteKnight I’ve read the documentation, but still don’t fully understand how the two differ, or how granularity is set. If it’s not set by the resolution selections, is it set by the rate at which data is received? Maybe I need to send the state more frequently, instead of just when it changes.
In my graph, the Pump state is ON for only a few minutes every 4 hours. It’s not intuitive to me that even the longer Hour granularity would cluster the short and infrequent ON intervals, rather than the several hour long OFF intervals.
When the Blynk server receives data it buffers the values for a 1 minute period, averages them, and writes the result to the database. This gives the 1 minute granularity and is explained in the documentation like this:
Blynk Cloud accepts 1 message per minute per pin. In case you send your data more frequently your values will be averaged. For example, in case you send value 10 at 12:12:05 and than again 12 at 12:12:45 as result in chart you’ll see value 11 for 12:12.
I believe that the 1 hour granularity is obtained by averaging the 1 minute values in the database once per hour.
I assume that the 1 hour granularity data is used to speed-up rendering of the SuperChart views in the 1 week + views.
I’ve not really studied in detail the differences between the normal and high resolution views for the same period, but my take is that the lower resolution views are smoother than the high resolution views. If the underlying data is the same then I’m guessing that this is more about how the data is rendered in the app.