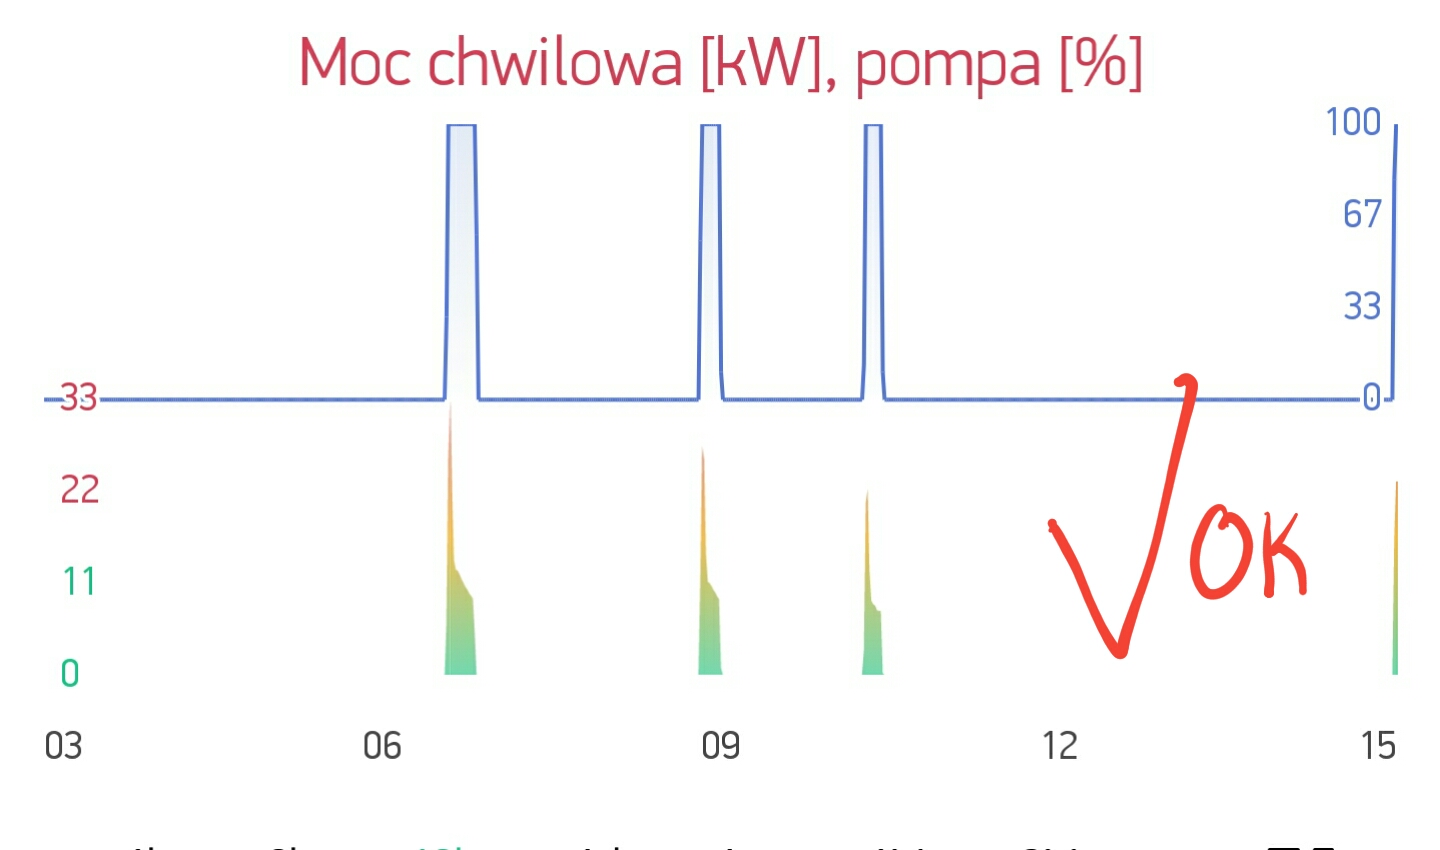
@BlynkAndroidDev, another annoying “insect” in the SuperChart’s garden: A two stream graph, with split Y-axis 0-50% for one and 50-100% for another stream. They displays fine initially, look below:
Now just scroll back in time. And what we see? Look:
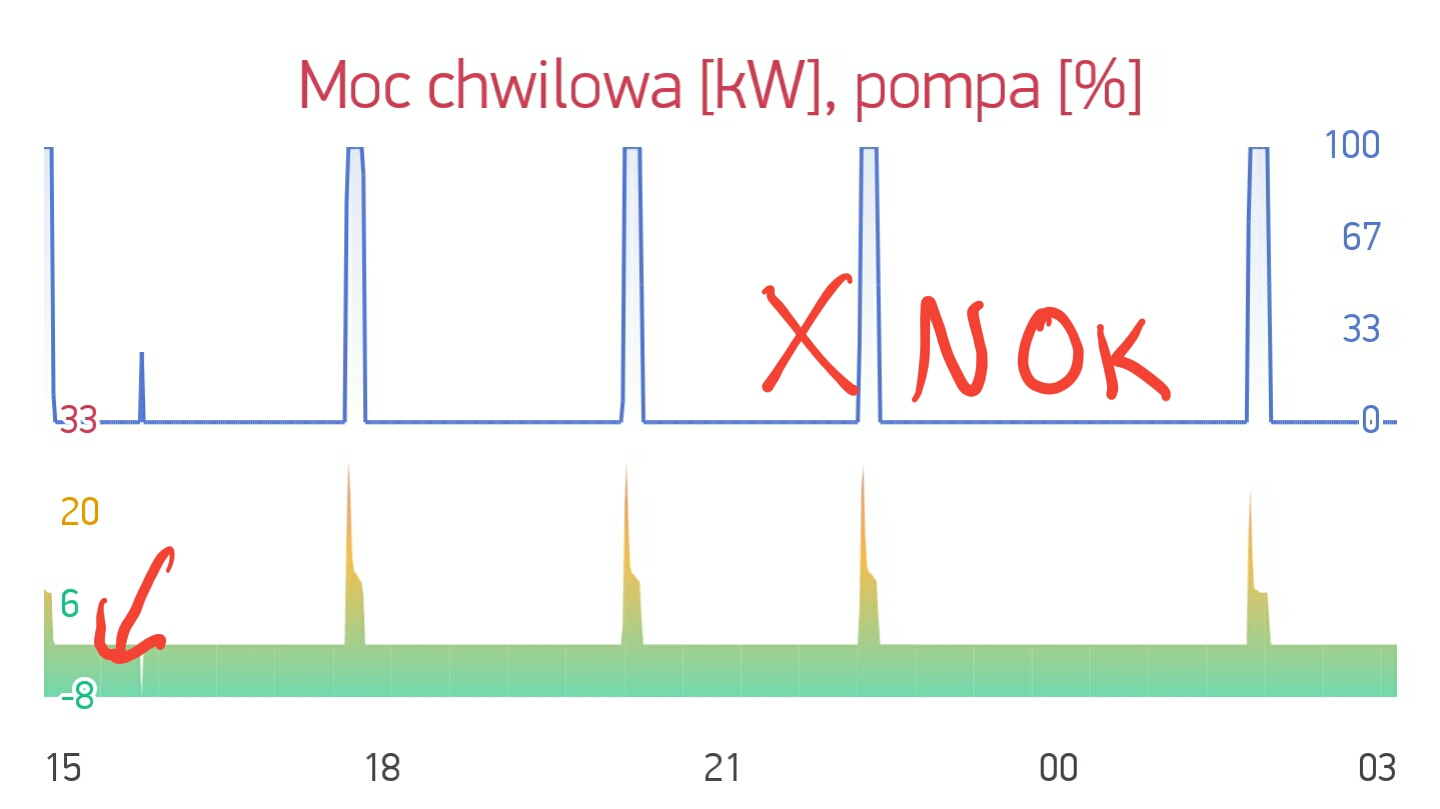
The bottom stream now shows values it never received, below “zero”