i created a project with an 8266, and a flow meter. the flow meter code reports ONLY when there is actual flow. there is also a value reported for the highest rate recorded… so you can see current /last vs max.
i got it all setup and wan’t able to actually connect it to the water system it is measuring, before I left on a road trip.
but the unit has been online and reporting once a minute for the last 4 weeks without any trouble until this week…
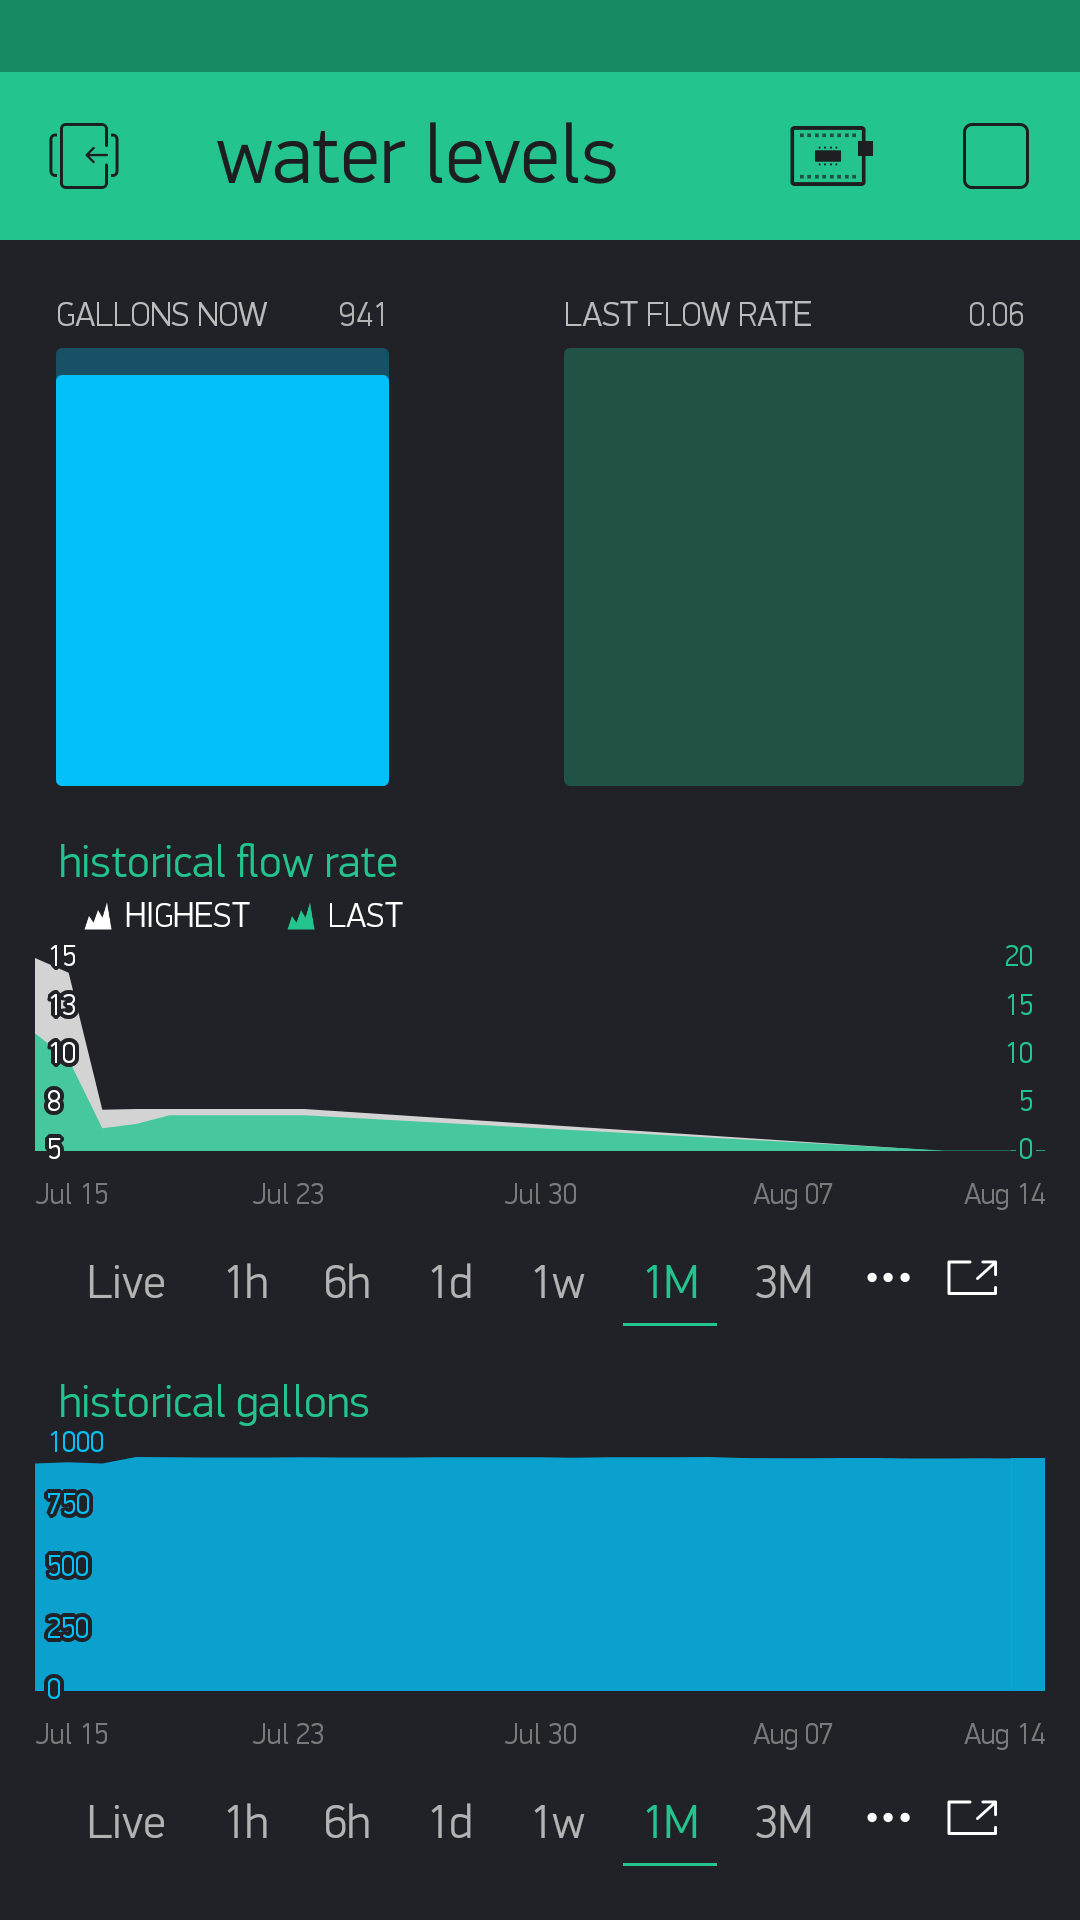
suddenly the flow rate and old highest have dropped to zero… i have the graph set to fill for missing values.
did i hit a time limit or did the base implementation of the graph change?
i have another graph on the same screen from a different pin, and it is showing properly…
no one has been in the house where the unit is for the last 4 weeks.
Now
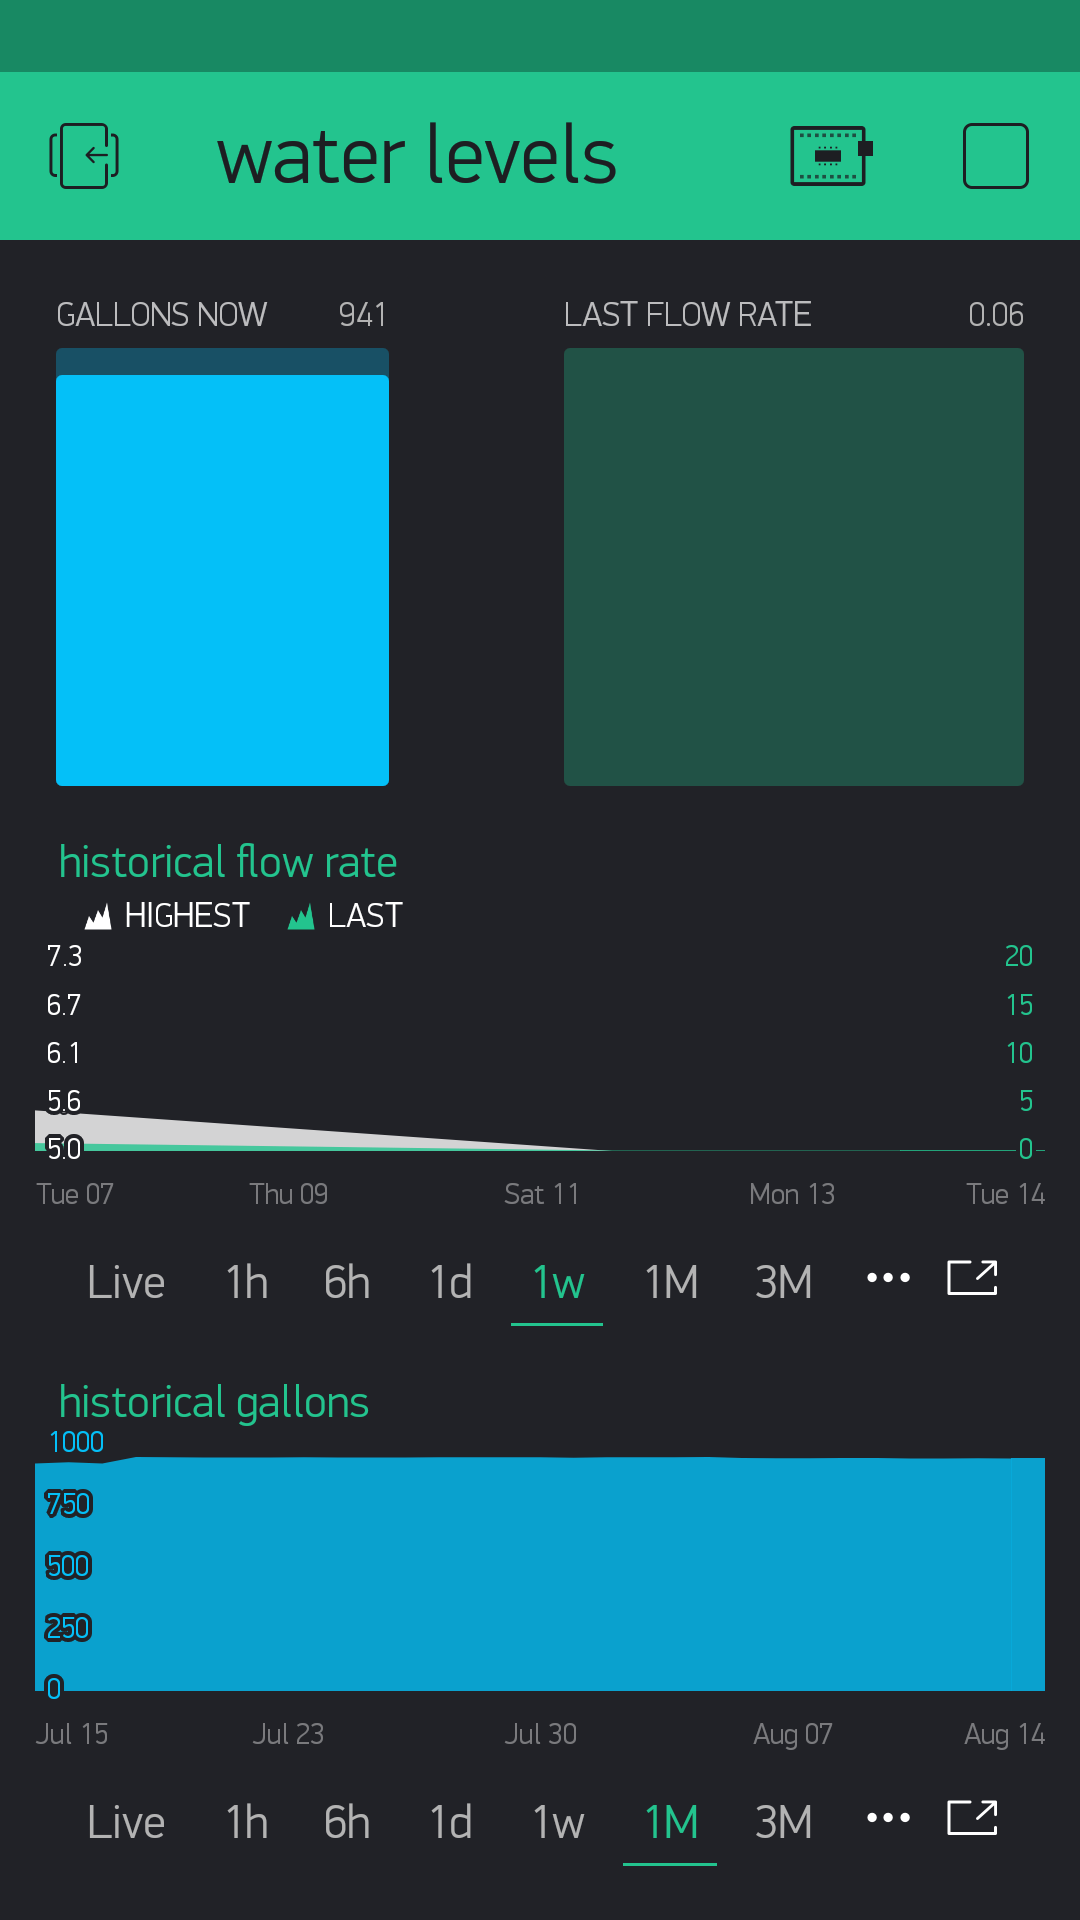
Before