I’ve been running my own legacy local server for a while with no problems, but I recently built a power meter based on the ESP32 and I’m finding that the power consumption history in Superchart isn’t displayed correctly.
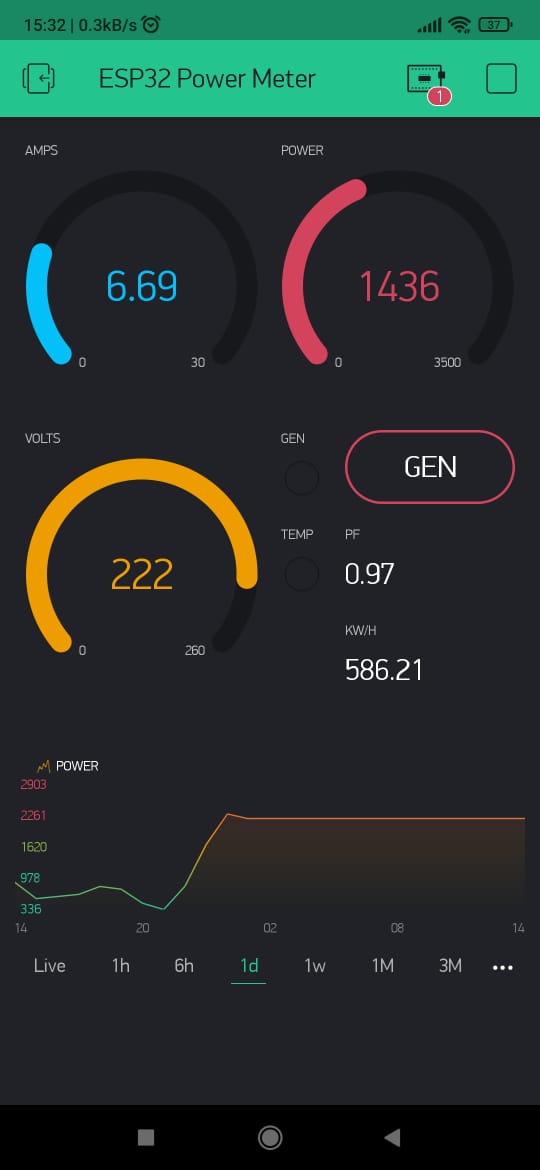
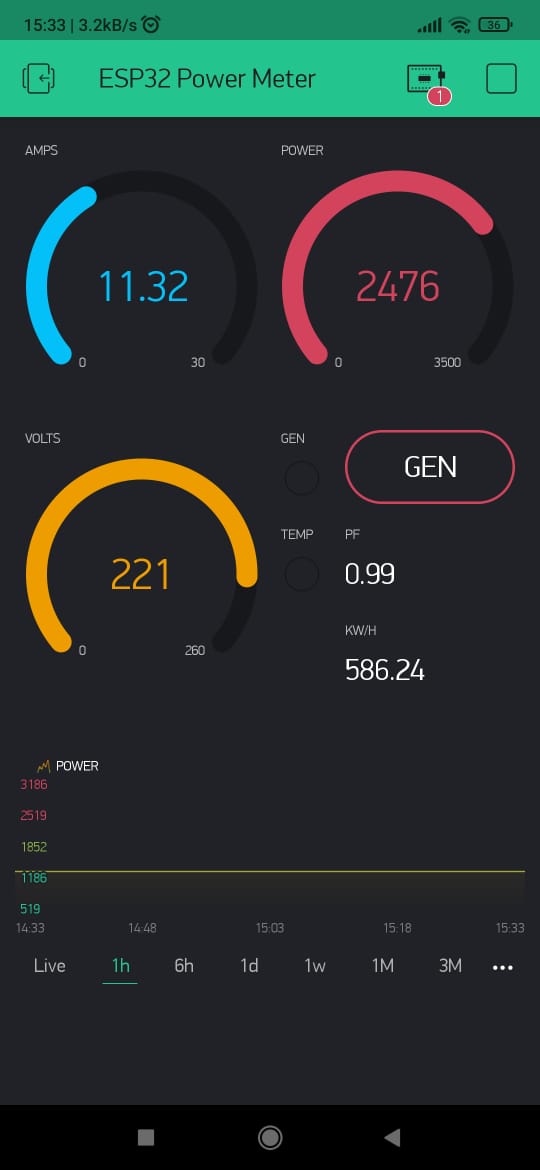
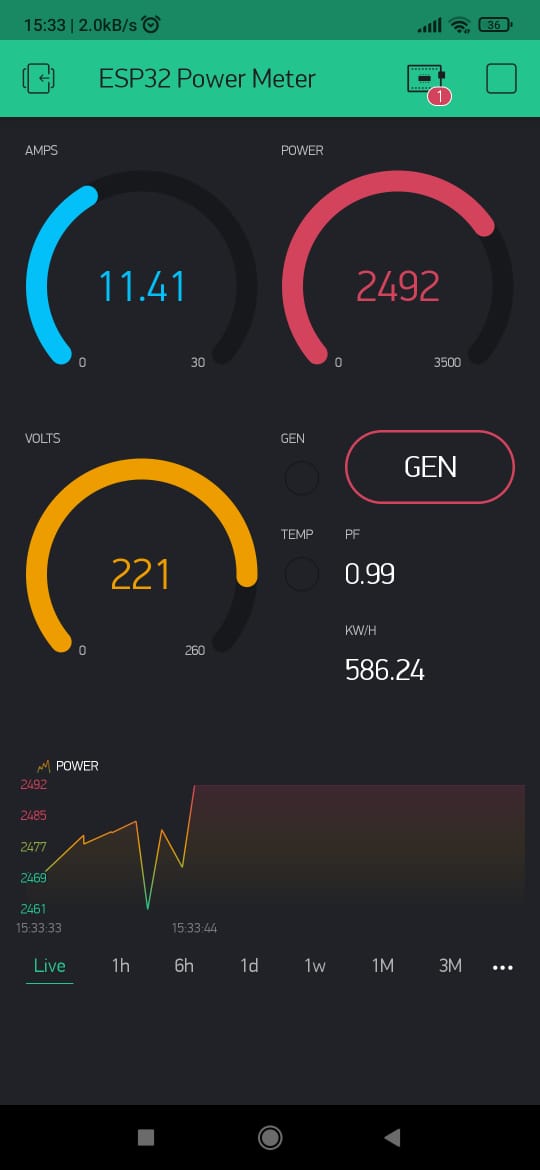
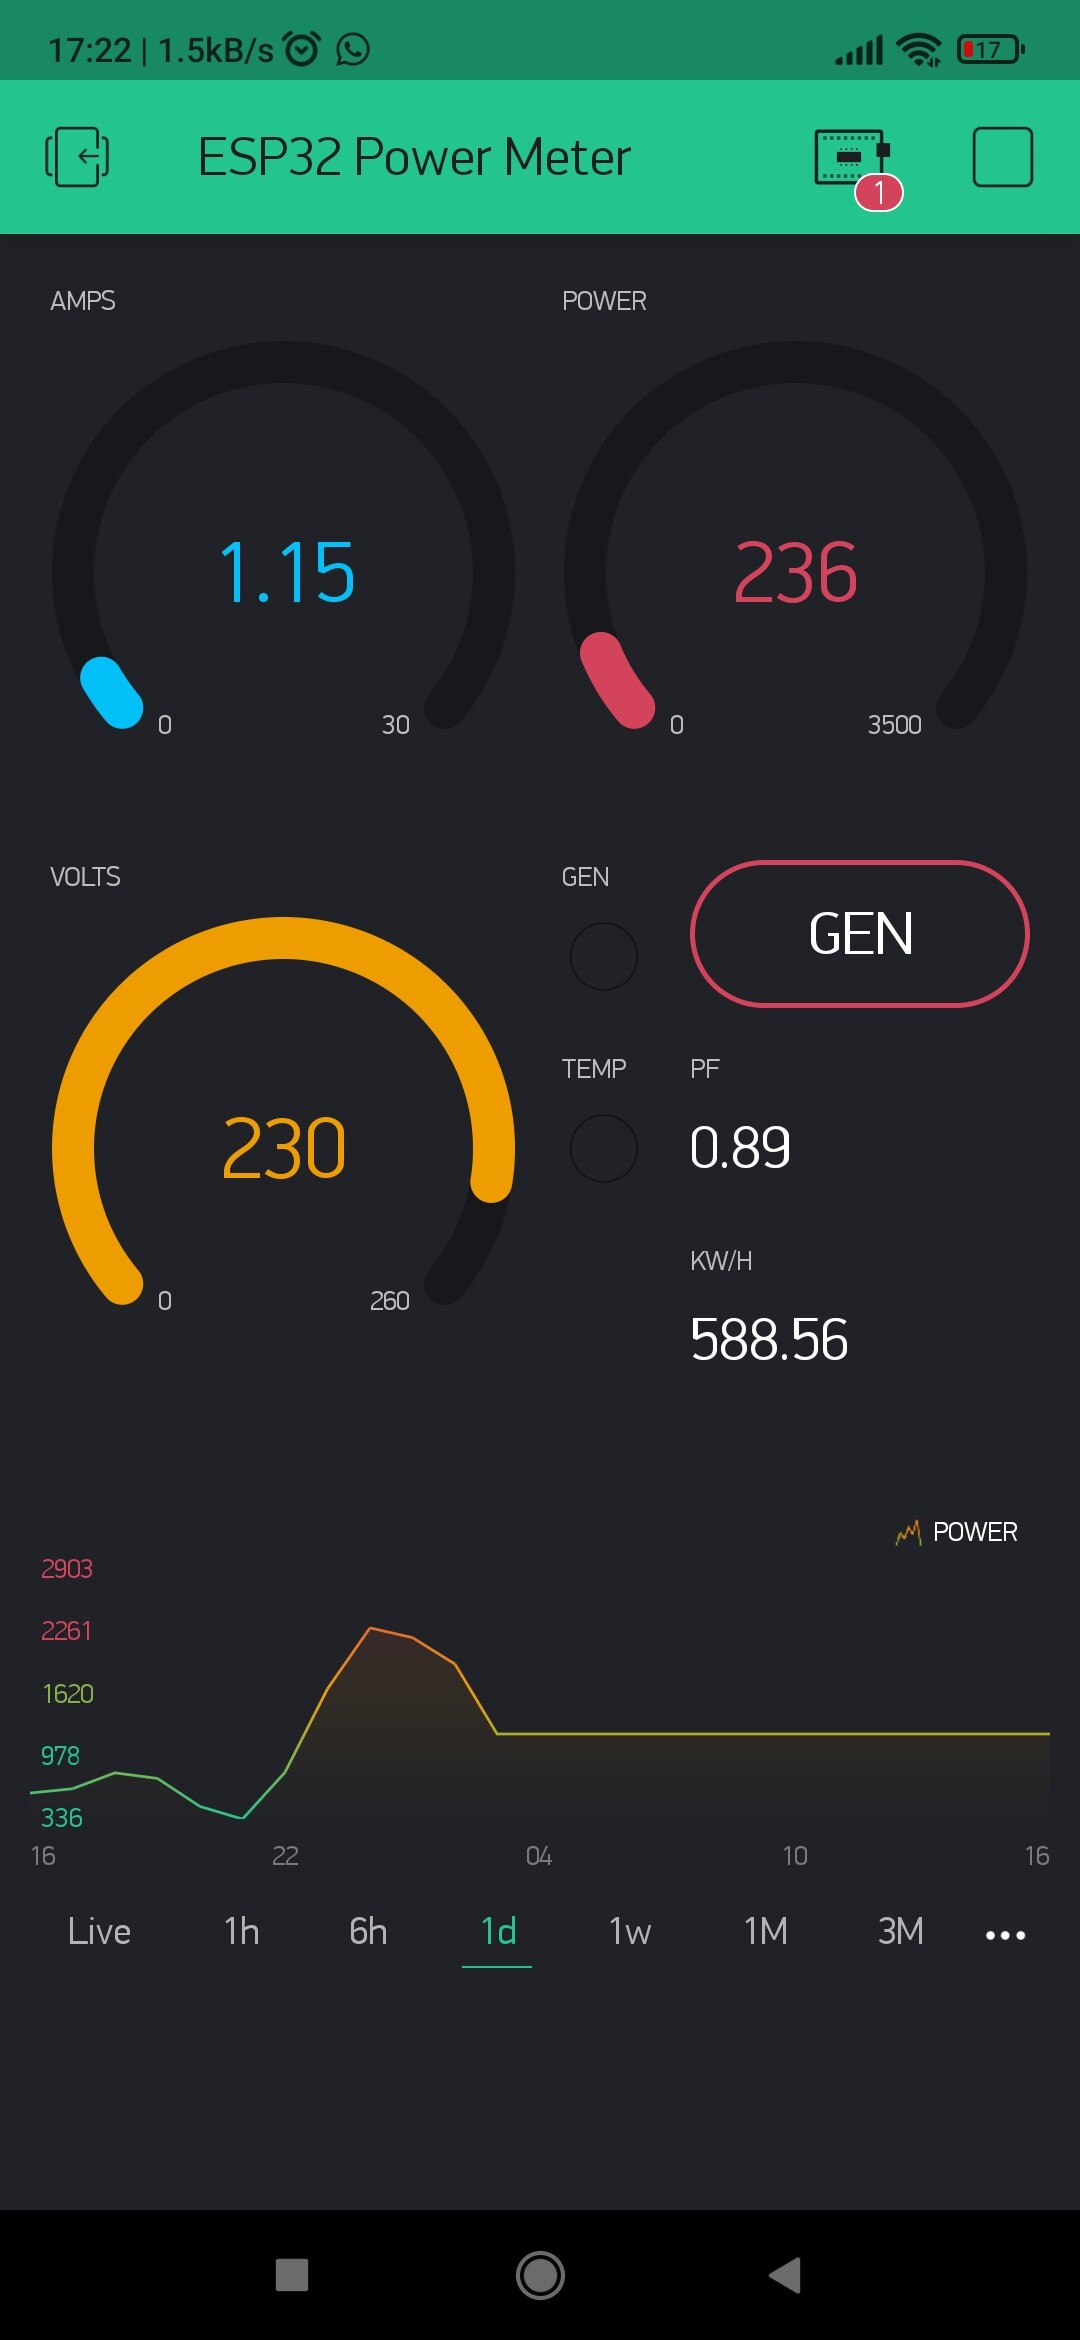
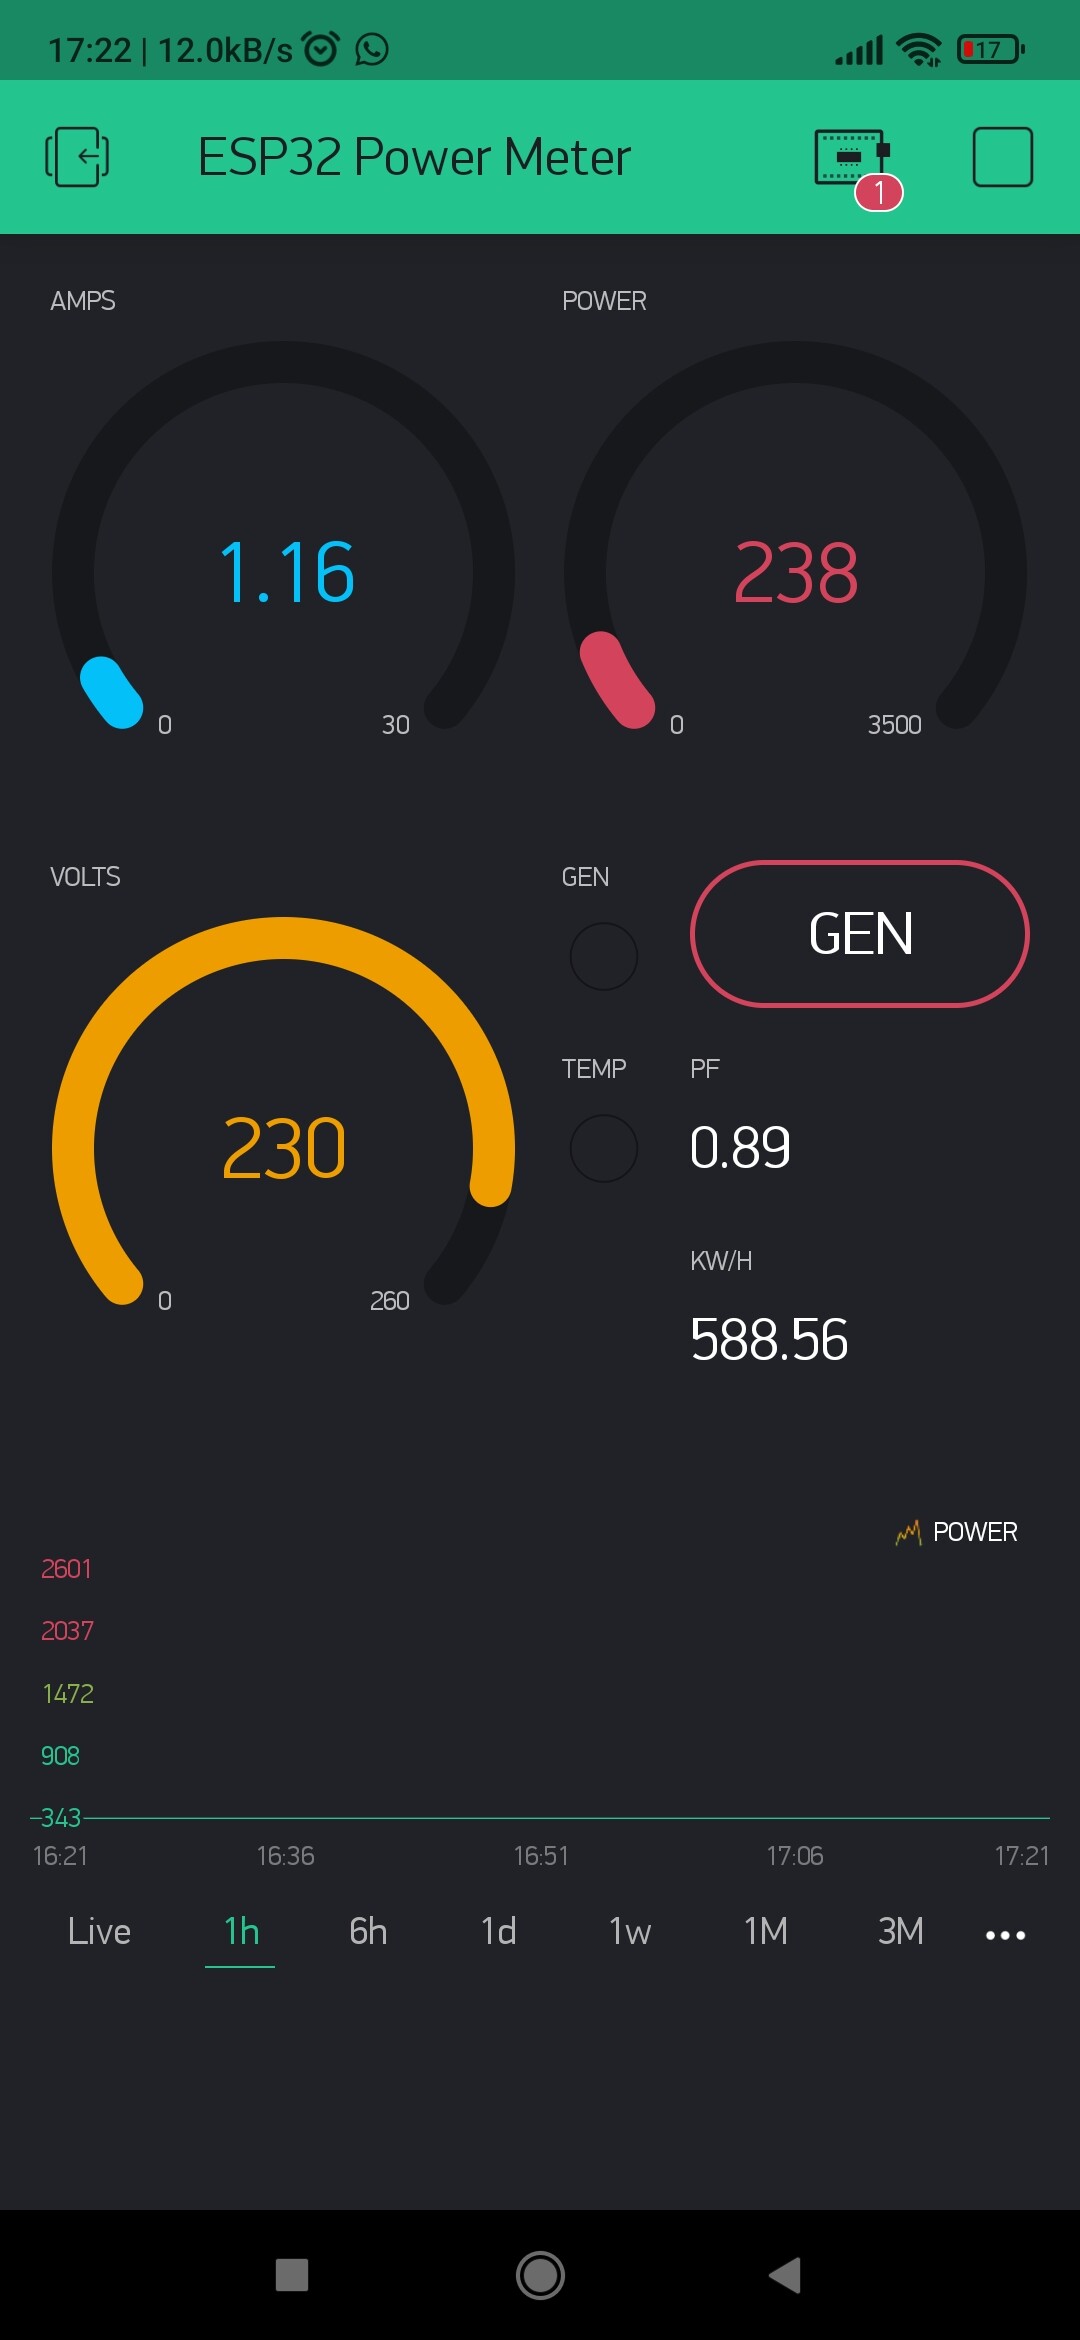
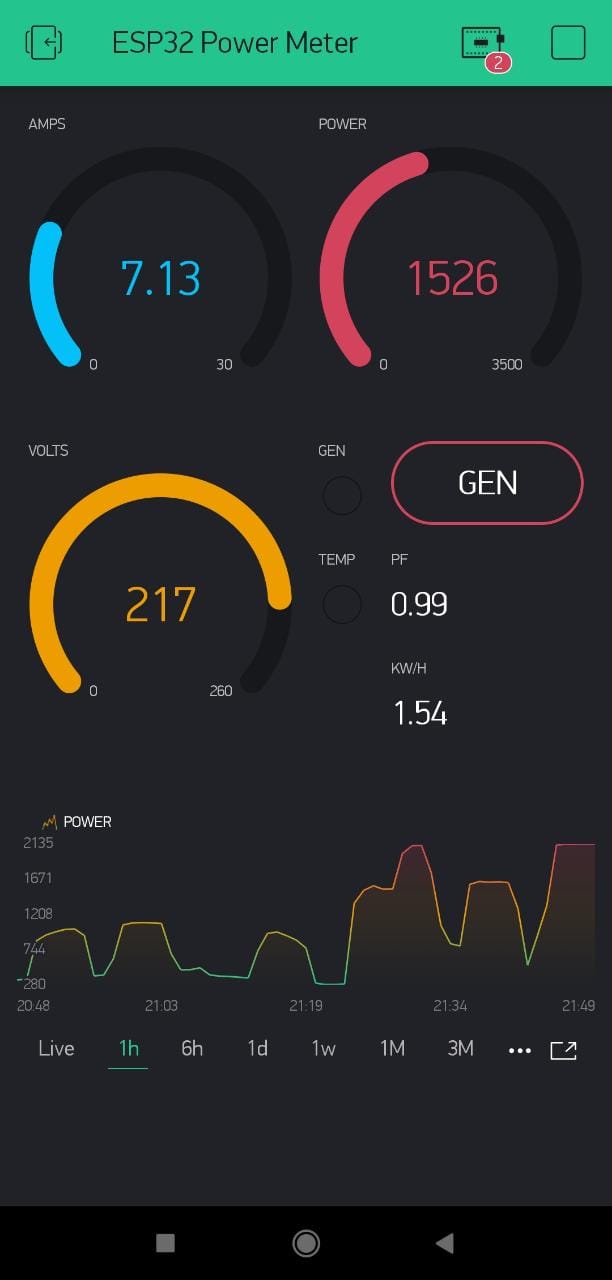
In the “Live” option it shows the consumption in real time which is correct, but when I select “1 hour” or “6 hour” I only see a straight line (maybe an average?)… “1 day” it seems work well.
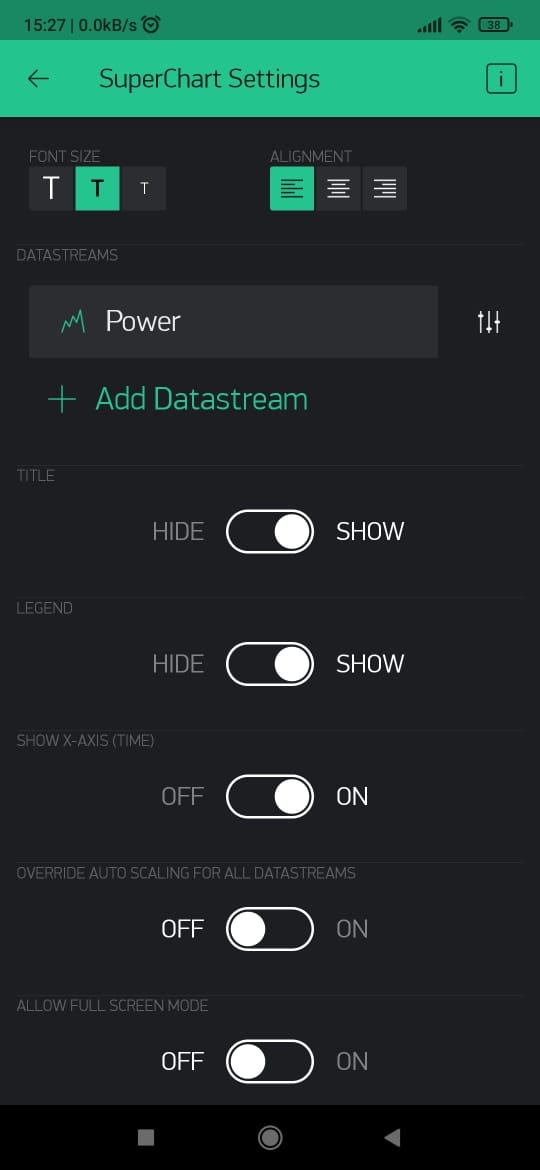
In my “server.properties” file I have the following options enabled, even from the admin panel I can see them.
enable.db=true
enable.raw.db.data.store=true
I hope you can help me. Sorry for my English, my native language is Spanish.
Yes, the Blynk Legacy local server averages the Ealing’s sent to the server over a 1 minute period and averages these values, before writing that average to the database. This is the highest level of data granularity available in the non-live timescales of up to 1 day. After that the hourly values are averaged and it’s these that you see in Superchart.
Your last hour seems like a very flat line in the 1 day view, so I’m not surprised that the 1 hour line is also flat.
Try introducing some very high or low consumption values for a period of more than 1 minute to see what happens.
The Legacy documentation explains the averaging very well…
I have updated the local server and the android app to the latest version available, but the problem is still there.
I am currently running the local server on a Windows 7 ultimate X86 computer, but initially as a test I used to run it on a Windows 10 X64 desktop.
If I run the same local server again on the Windows 10 X64 computer, Superchart works fine. When running on Windows 7 computer, I only see a flat line on the supergraph.
Do you think it’s a Windows 7 problem or because I’m using a 32-bit version?