When I change the chart axis ‘y’ values it all looks good but no matter what you set them to it defaults to 0-100 for every datastream on the chart. Is this a known issue ?
Cheers
kev
When I change the chart axis ‘y’ values it all looks good but no matter what you set them to it defaults to 0-100 for every datastream on the chart. Is this a known issue ?
Cheers
kev
I think you’ll need to provide more info…
Pete.
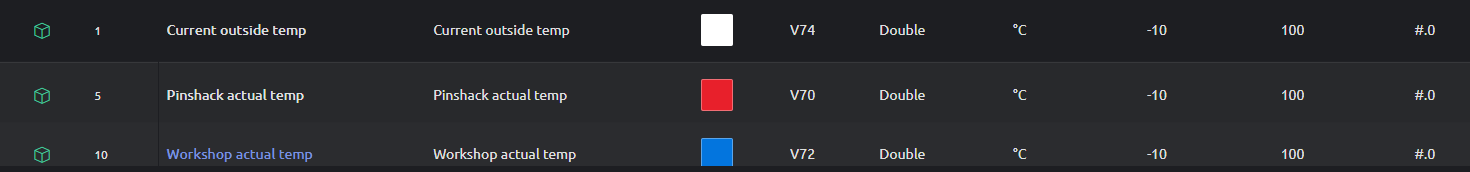
ok sorry Pete - this is on the web console. three data streams on the chart each set up with
data streams as follows
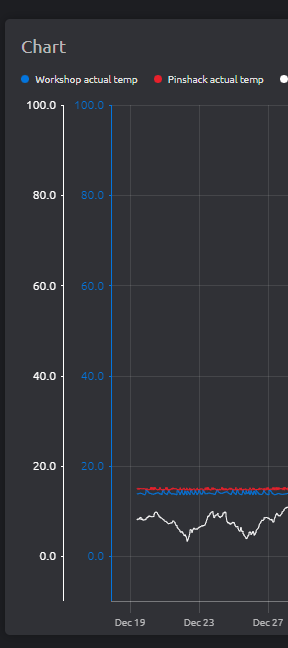
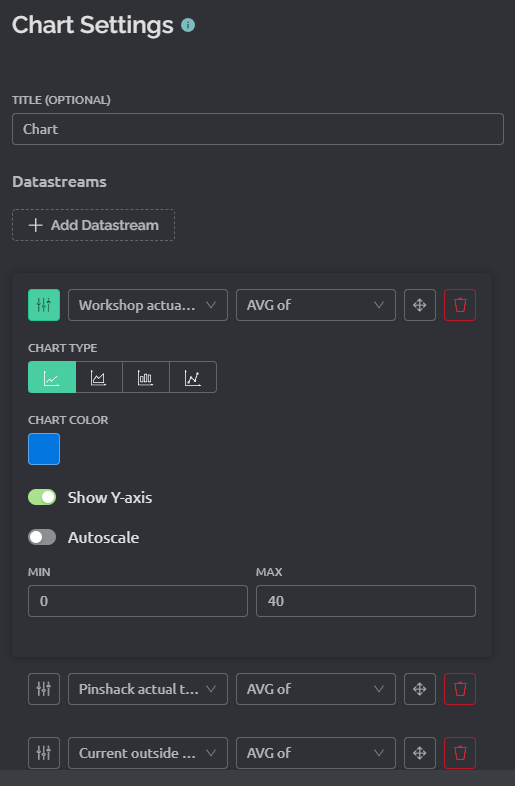
and here is the setup of one of the datstreams on the chart V72 note min and max 0 to 40
but appears on chart 0 to 100
It looks like the Y axis is actually showing -10 to 100 (the zero isn’t at the bottom).
Presumably this is coming from the datastream min/max values.
Hopefully you don’t actually see air temperatures of 100°c very often, so presumably these values can be reduced?
Pete.
so do the values set in the chart min max not override the datastream values pete ?
As usual you are correct Pete!! it seems like it takes the axis values from the datastream min max and not the chart datastream min max values - a bit odd ?
Cheers
kev