Re: Web dashboard and Datastreams.
In datastreams i can set a datastream variable to Double and Datatype to #.# or #.##. OK
It will then be with 1 or 2 decimals both when plotting in graph and when displayed in gauge.
I don’t like that.
I’d like to display, typically temperature, with 1decimal in gauge and plot with a resolution of 2 decimals in the graphs.
**- Is this possible in any way? **
To plot in graphs with 2 decimals and display in gauge with 1 decimal.
(By using just one datastream value and not two separate datastreams.)
One way of achieving this would be to set the number of decimals displayed in a Gauge. I.e. use #.## for the datatype, but to display as #.#.
Why I want his?
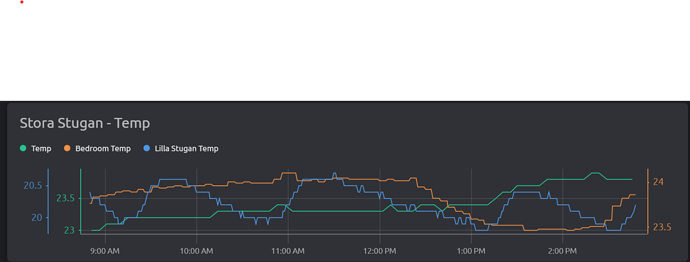
If you display graphs typically in autoscale and shorter time spans where the max and min is not that different - the plotted graphs become very “digital” rather than “smoothed” as they could be. At the same time, I don’t want to display the temperature as “23.95” but rather “23.9” (or 24.0).
I’ll add some images as reference.
Plot/Graph with 1 decimal resolution. Gets “digital”. A 2 decimal plot would like “nicer”.
How gauge display look with 1 or 2 decimals. I prefer ALWAYS to be with 1 decimal (for Temperature).
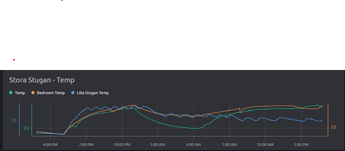
Just showing how the temp plot looks over a longer range of time. Here the variation (min, max) is larger and the 0.1 resolution (=1 decimal) is not a problem. This graph looks is OK.


