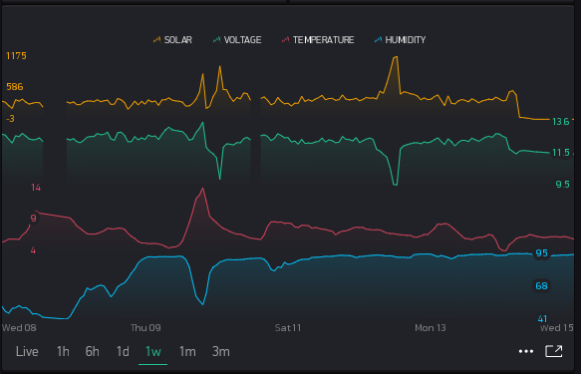
Can’t the ranges already be setup to ones heart’s content? Here are three ways I have displayed the exact same data (and still more options are availed):
%, with each split into 1/4 screen
%, with each full screen
Values based on Min/Max
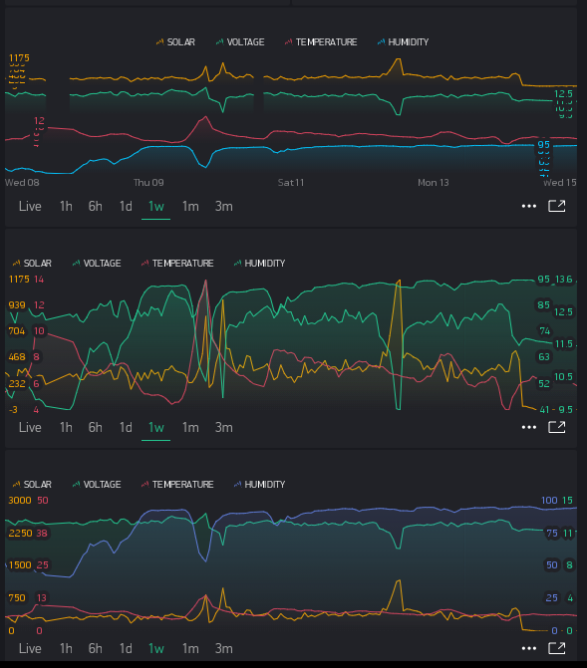
The Y-axis numbers in some are all scrunched together, but that is only because I have reduced the chart height to its minimum in-order to fit all three into the screenshot. I normaly run with this format: