Hi. I’m really starting to like the new superchart. I have a suggestion that migth boost it a little bit further.
I’m using it for several inputs relateted to each other but not in same range. Eg. 3 different temperature readings.
Right now i i have them all on top of each other and that way i cant easily compare the values. I could make the range of the chart fixed but then i will often have unused areas or miss value of the inputs. Could it be possible to make an option to sync the y-axis so that it is the same range for all inputs and at the same time adjust the min/max values of y to the given inputs?
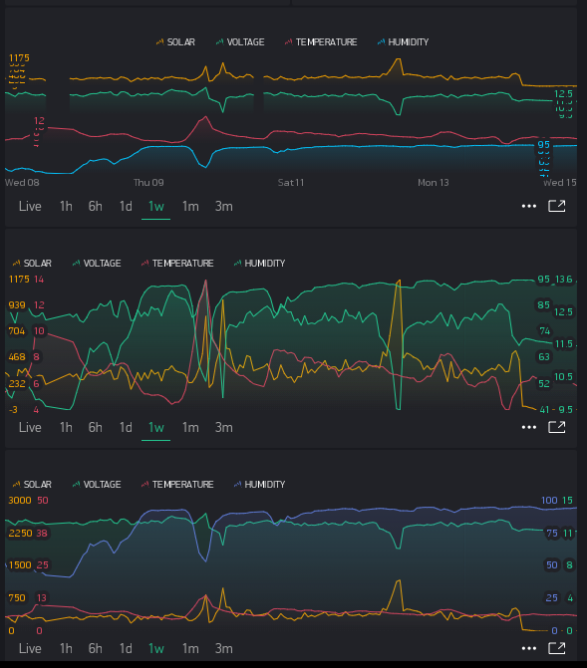
Can’t the ranges already be setup to ones heart’s content? Here are three ways I have displayed the exact same data (and still more options are availed):
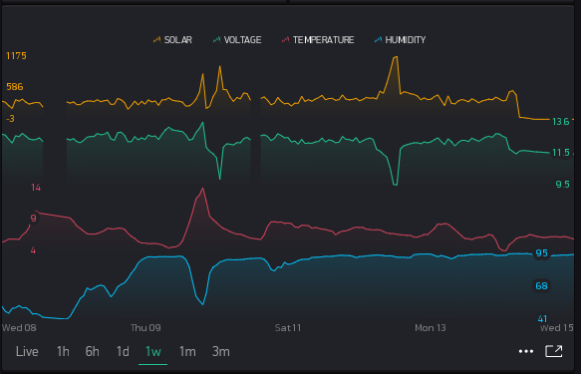
The Y-axis numbers in some are all scrunched together, but that is only because I have reduced the chart height to its minimum in-order to fit all three into the screenshot. I normaly run with this format:
HI again. Sorry for my late reply. @Pavel I can see that i might have been a bit tired when i wrote it
@Eugene Thank you, but i will just clarify my initial idea to make sure its not misunderstood.
My idea was: I have 2 (or more) data streams. both displaying same unit but diferent ranges. I would like to be able to have the same Y-axis scaling for these. I could to this by entering same min-max values for both streams. But then i won’t have autoscaling.
And if the values are varying much then lot of space will go unused or some of the stream will go outside.
So some way of using the same scaling/min-max for multiple streams and still keep the autoscale function which is quite nice
Hope this make more sense.
im not sure if this is what you mean by the way the old historygraph does it.
I’d like to have a single y axis scale option for all or part of the data streams.
It would be even better to be able to modify each y-axis from my code. So I can find the maximum of the data stream in my code, and adjust all the y-axis I want to modify accordingly eg. Blynk.Property,Yaxis1 = value; (where value could be the max of all u axis data in the data being written to the graph, or a select set of data on the superchart.