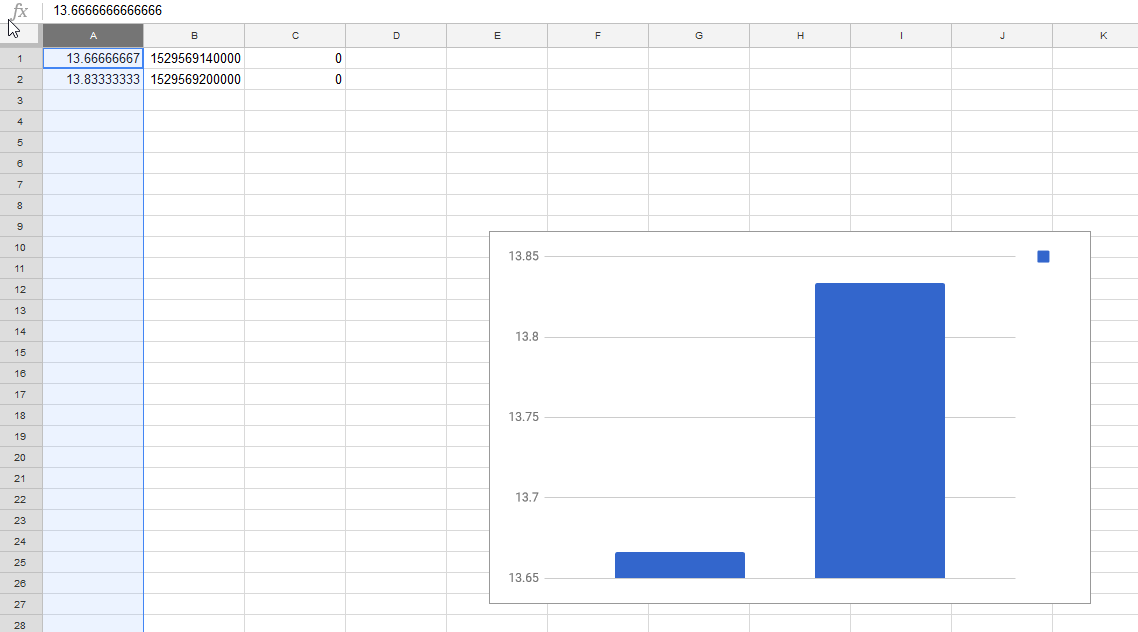
Hi friends. is any way to convert blynk exported CSV data to graphical chart ? I want showing exported CSV data on PC with graphical chart.
thanks.
Hi friends. is any way to convert blynk exported CSV data to graphical chart ? I want showing exported CSV data on PC with graphical chart.
thanks.
Excel, or any other spreadsheet, will have that ability.
There is… it is just in UI or Unix time (your column B)… Google for conversion options… probably even some topics here about it.
Glad it works for you… mine insists there is no data, when I have months of it… I do not like tiles 
In the latest release tiles are not required.
Well, running App 2.26.1 and server-0.38.0-java8.jar only allows me to chose tile datastream… which shows in the tile, but says no data in the report.
And I don’t want to try server-0.38.1-with-8443.jar until I understand the “with-8443” bit
Hi friend
I got same problem with blynk data
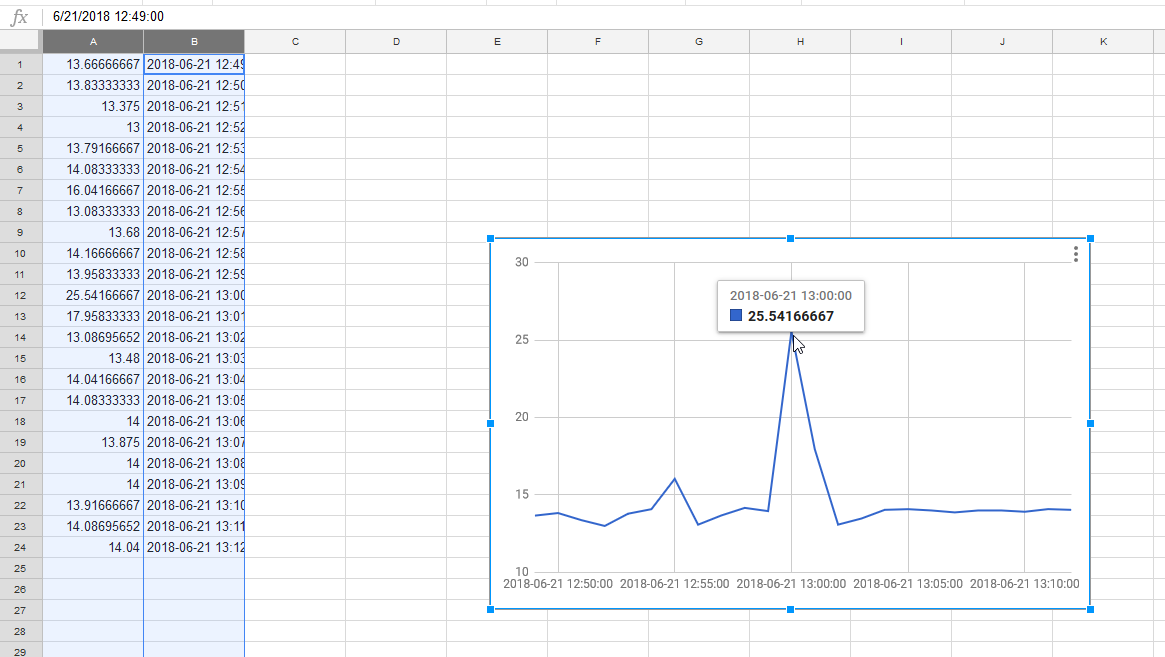
i can not convert value to data and time.
Could you help me?
My email : manhlephu@gmail.com
Thanks
This is an old topic. The conversion method is simply an Excel formula… and there are many web sites discussing such. I think there was even a recent topic or post in this forum. Search for keywords like Excel, etc. with the “most recent” sorting selection
EDIT - here it is…
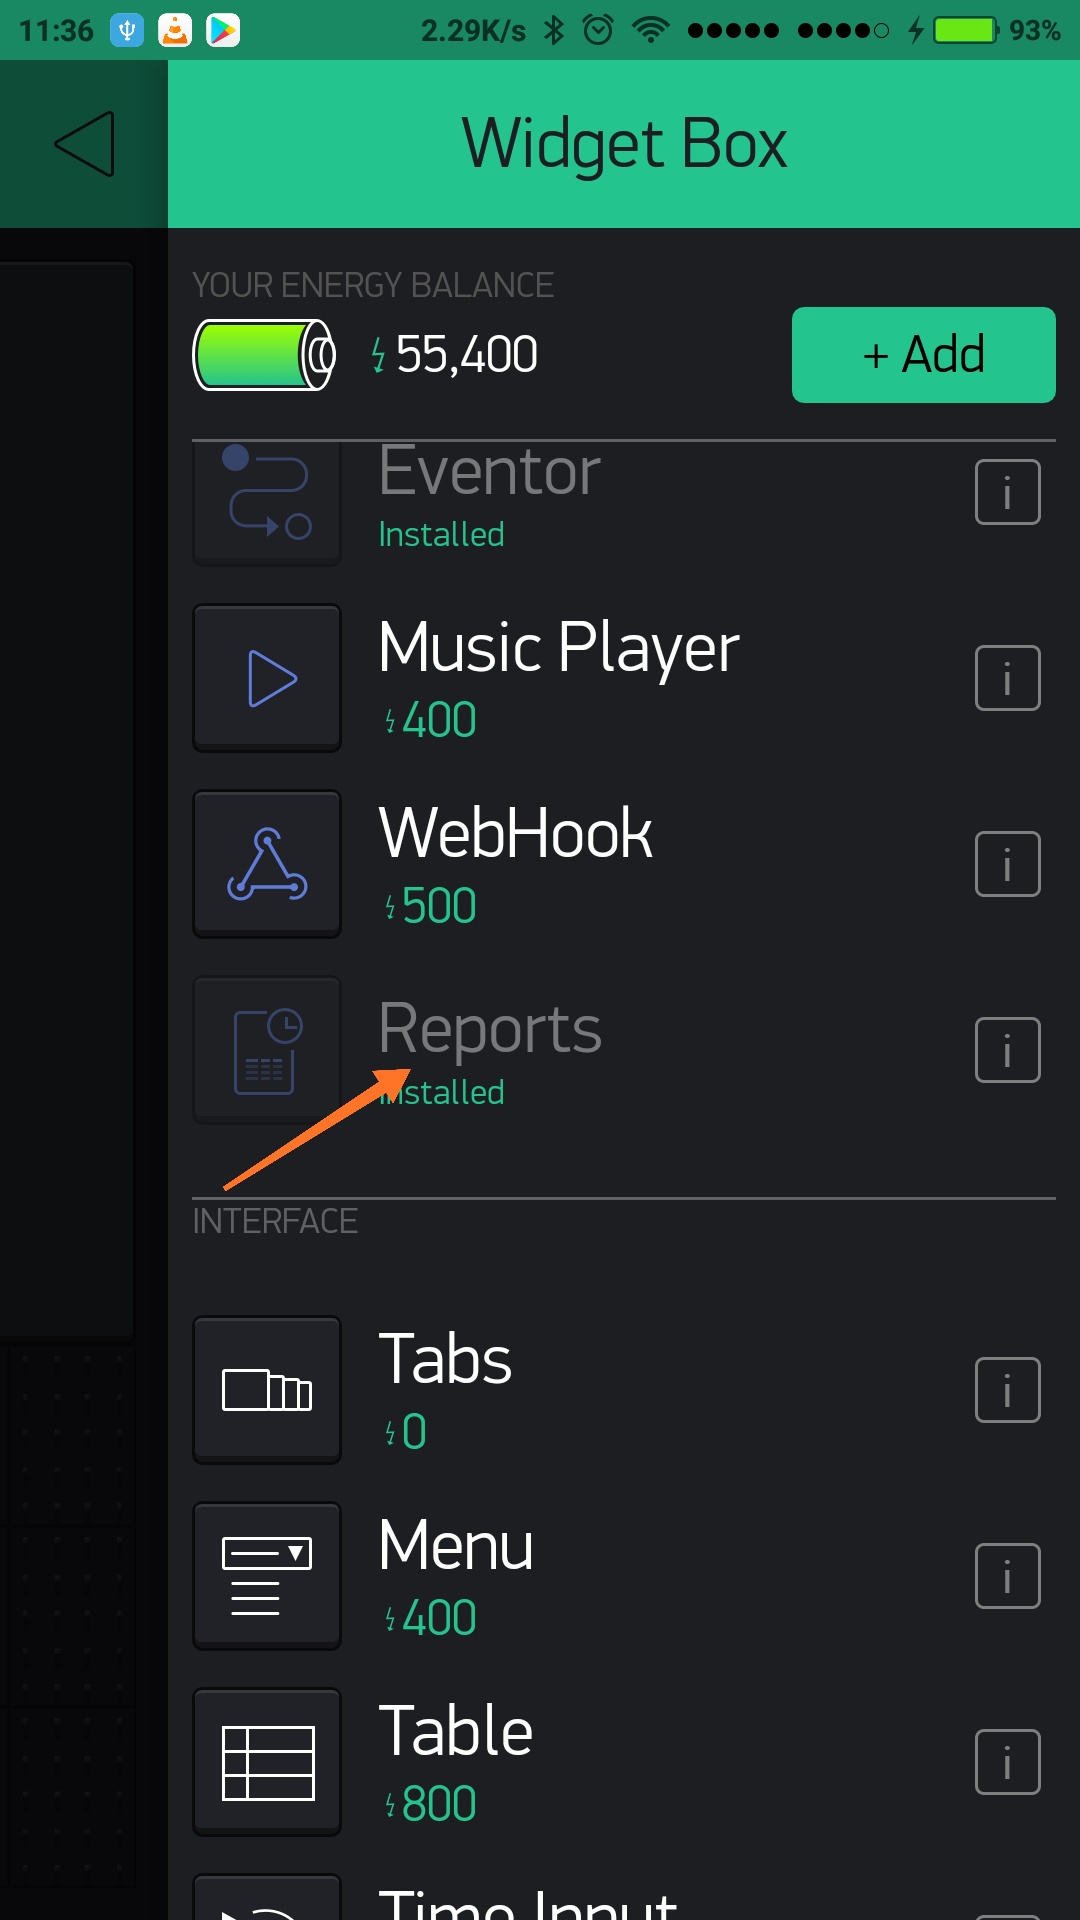
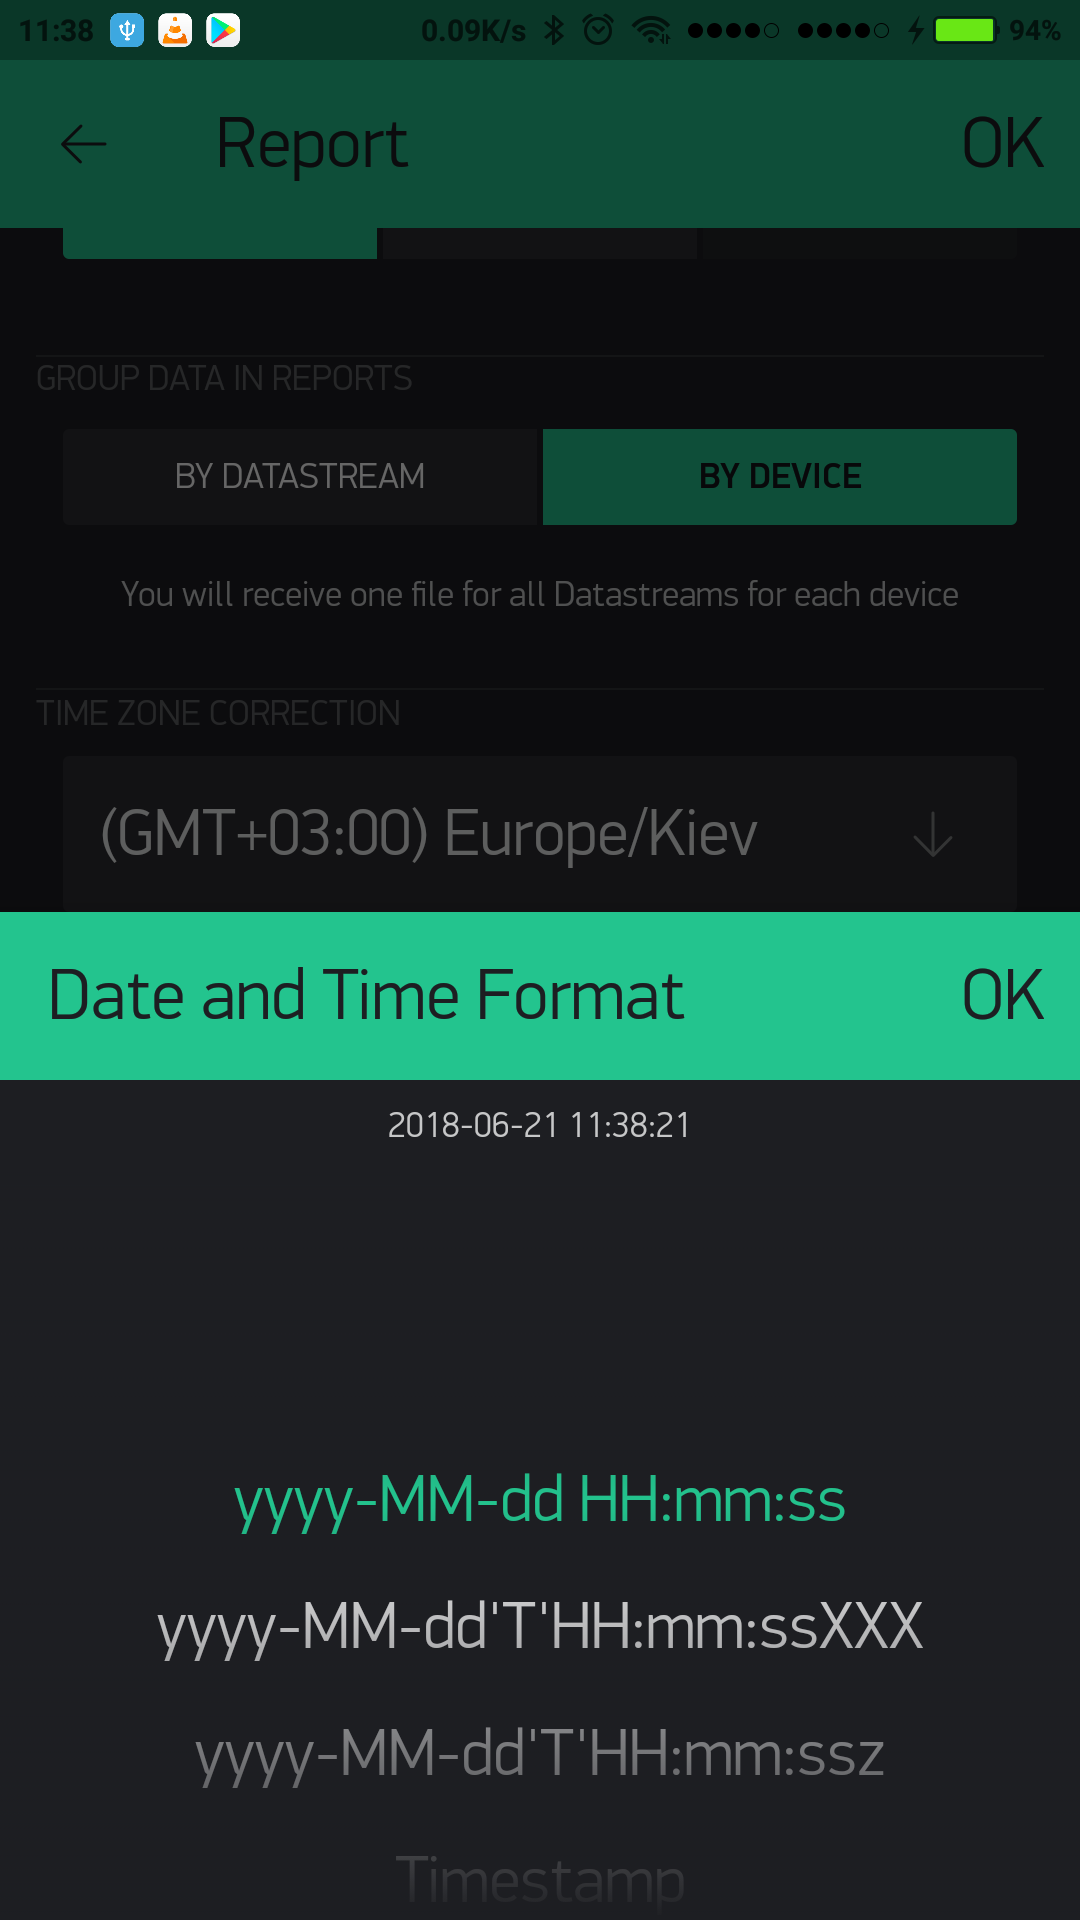
Meanwhile there has since been a new widget called the Reports widget. Please check it out in your up to date App, as the current CSV export will reportedly be discontinued and removed…