Hi, came across this graph in one of your Case Studies, “Dylos Air Quality Monitoring”:
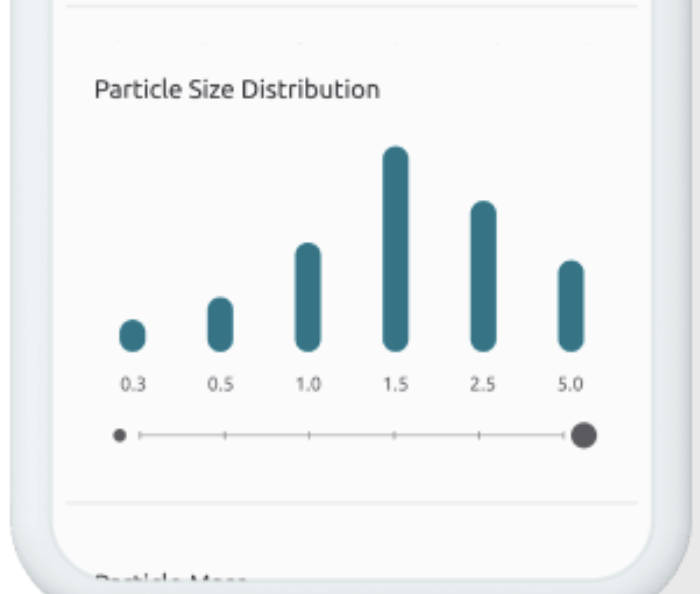
Which graph widget or design option will allow a non-time sequenced X-axis like this? I have a lot of use cases for a distribution graph like this. Thanks!
Hi, came across this graph in one of your Case Studies, “Dylos Air Quality Monitoring”:
Which graph widget or design option will allow a non-time sequenced X-axis like this? I have a lot of use cases for a distribution graph like this. Thanks!
These are 6 vertical level widgets and and an image underneath them (the axis line)
Excellent! Thanks for the clever tip!