Is it possible to set the history graph to have a low and high limit (i.e. 0 and 100). That would be nice.
1 Like
Hi,
Sorry, but it’s impossible right now. It scales automatically - this is how graph library works. Could you please describe your case and why do you need it.
Thanks
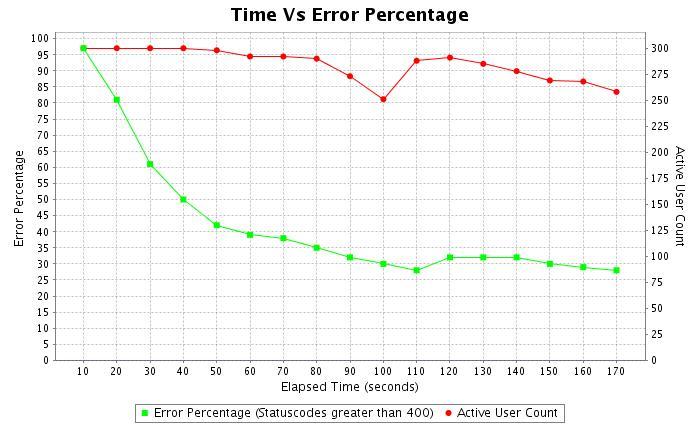
Thanks for the reply. To elaborate, I would like to show percentage vs time on the graph, but always show 0% - 100% on the Y-axis. That is, I don’t want it to auto-scale. Here’s an example:
Again, thanks for the good work you guys have done.
Phu
1 Like
We will add it as an idea. Thanks.
Can’t promise that it’ll be there soon because of the significant UI changes.
