first of all compliments for all the work on the Blynk App.
After doing an extensive search throughout the forum,I could not find a similar post.
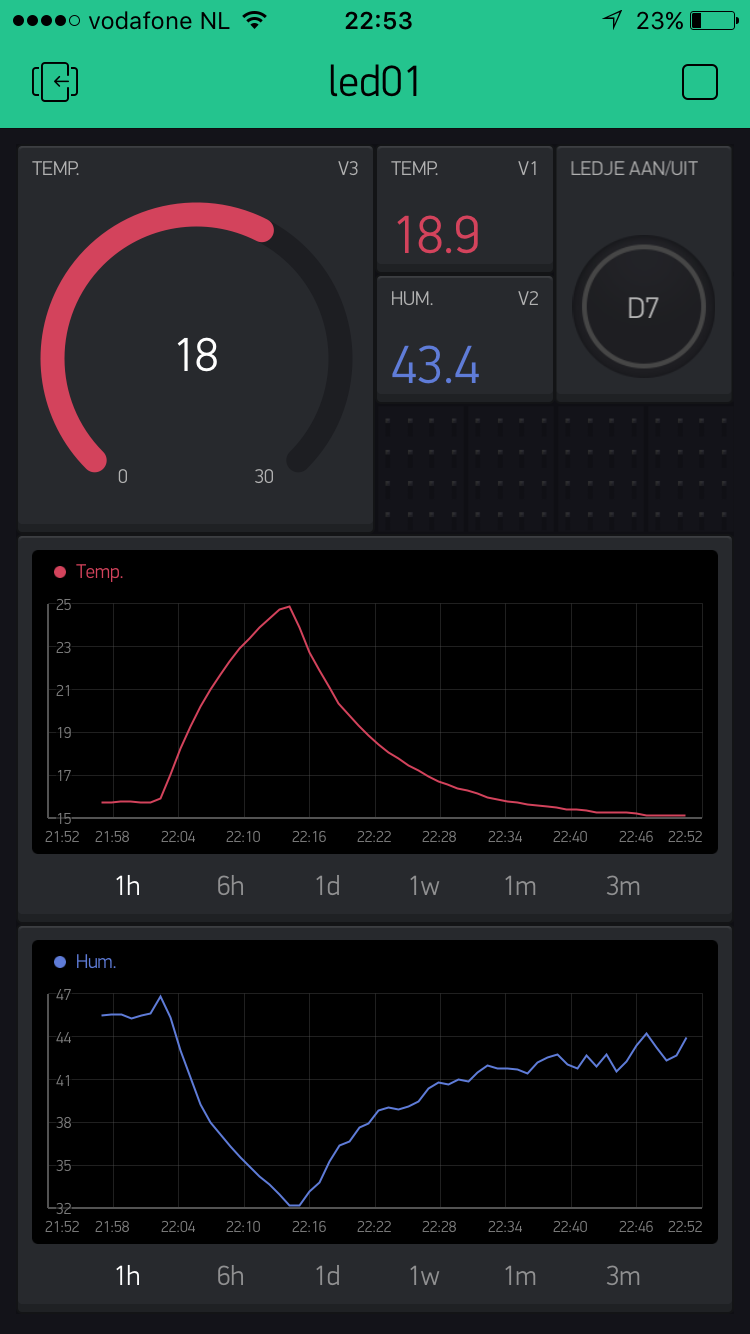
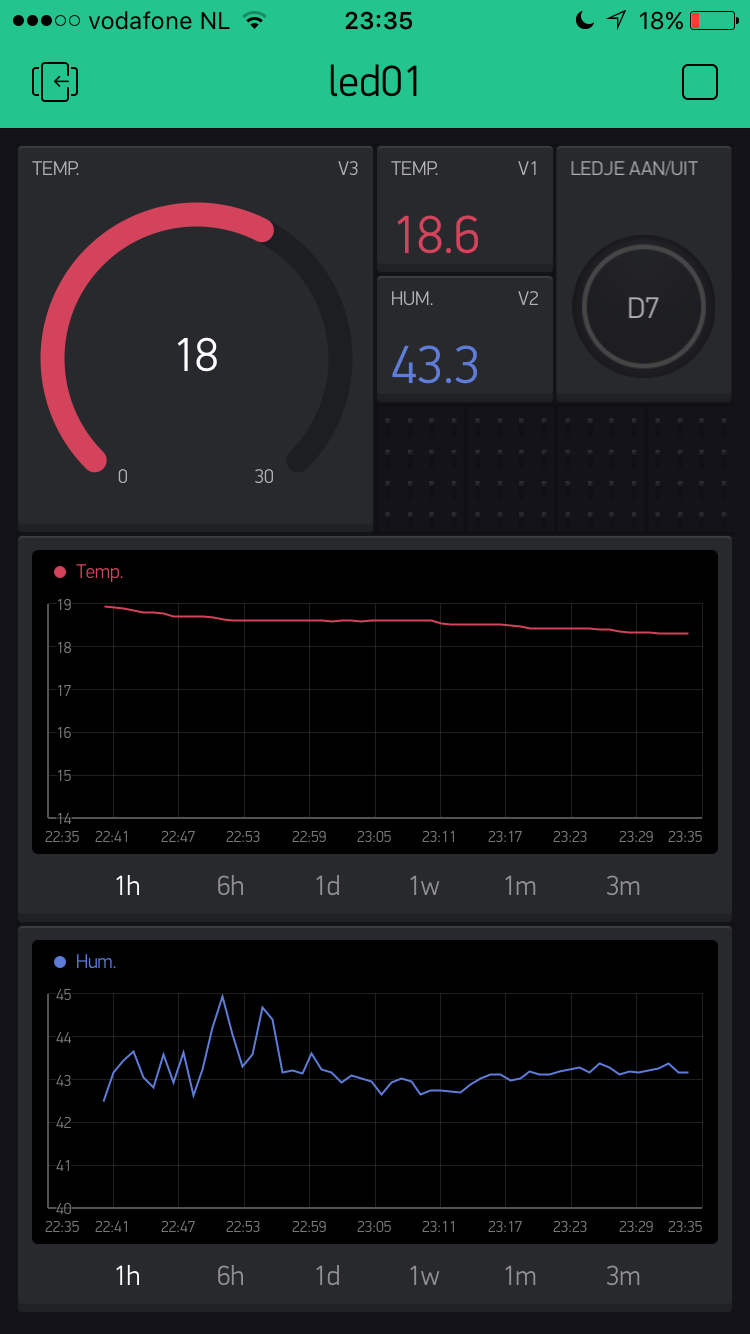
Seems that for the IOS 1.6 version the History Graph has an issue with autoscaling values. It changes depending on the ‘min/max’ vales of the plotted data? As can be seen in the screenshot the actual temperature is at 18.9 degrees, but in the History Graph it is at 15 degrees:
Data comes from a basic arduino sketch (using the latest blynk-library) with a single DHT22 and temperature/humidity send to V1 and V3, and humity send to V2 and V4 once every second:
/snip/ void sendUptime() { Blynk.virtualWrite(1, DHT.temperature); Blynk.virtualWrite(2, DHT.humidity);' Blynk.virtualWrite(3, DHT.temperature); Blynk.virtualWrite(4, DHT.humidity); }
/snip/
Is this already a known issue? Or am I doing something wrong?
P.S. I cannot trace back a detailed changelog for the Apps updates. Is there such an overview?
And it would also prevent bug-notifications on already identified bugs if a ‘to-be-fixed’ list would exist.
i am also having a mismatch between the values on the graph and what they should be. they seem offset by 2-3 (when the value is 10º it actually shows it around 7º on the graph)
also ios
alex
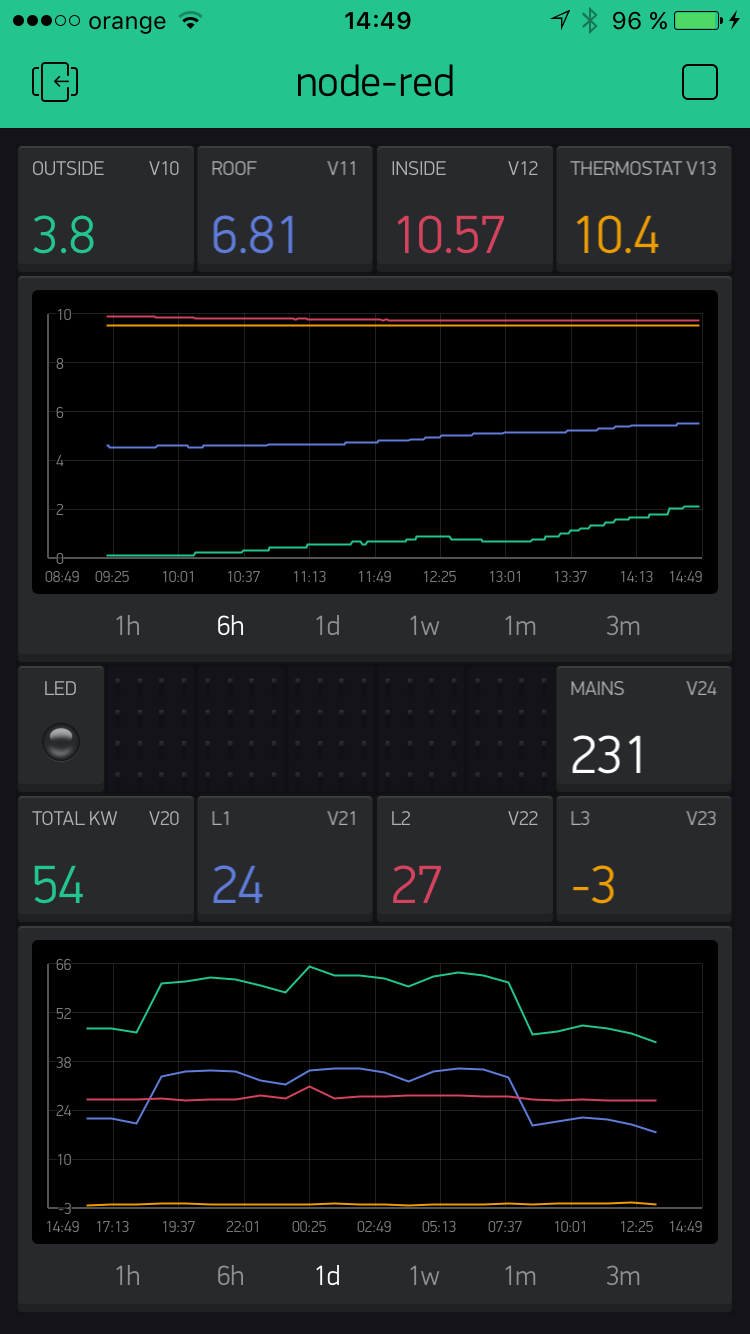
/edit you can see it here Environment & Electricity Consumption Dashboard while the value is 5.3, it is shown on the graf below the 5 gradation. that s actually a small deviation, but i ve seen it show -3 when it was actually about 1
@mclee1004@tzapulica are you sure this is a bug? History graph shows values with 1 minute delay, while value display shows data in realtime. @tzapulica I know you are using local server. May you give me please your graph data + csv?
sure, is there any private data in there or can i just post it here?
my values are slow changing, so even if there would of been 3 hours of delay they should of been rather close
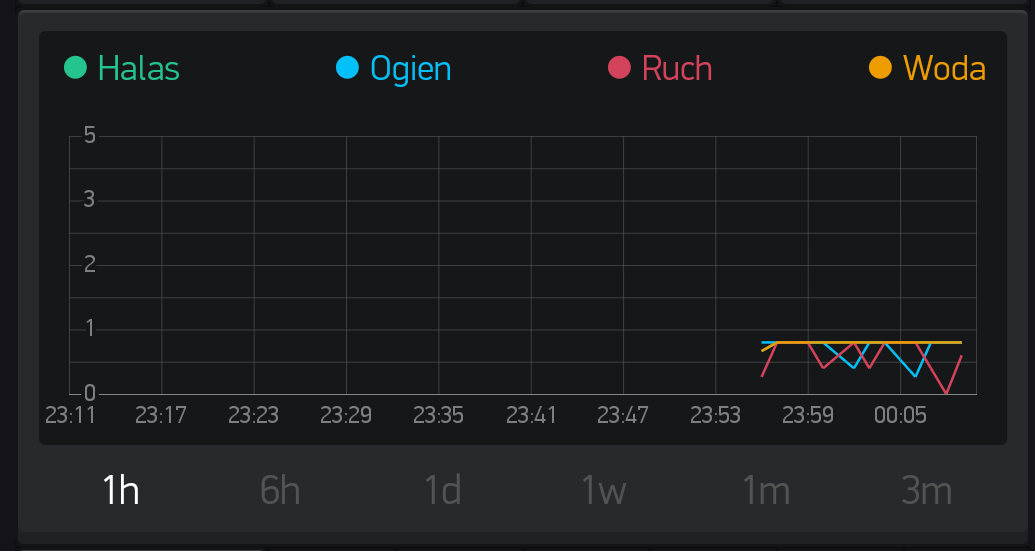
This is how boolean graph looks like on android, for me thats also scaling problem… Instead of 0-1 and Y axis auto scaled to 0-1, I get some intermediate values and graph scaled to 5 which is useless and barely visible, I use for example: Blynk.virtualWrite(V6, fireDetected);
I am having the same scale issue as Garreth after the IOS app update. Is there any way to correct? All I need is 0-1 but I get a graph scale of 0-5. Lots of wasted screen real estate and lines are barely readable.
It is not very encouraging to sit here for more than a week with no response to this issue, which I am obviously not the first one to raise. If it cannot be corrected, please let me know, but ignoring the issue is not very good customer support.