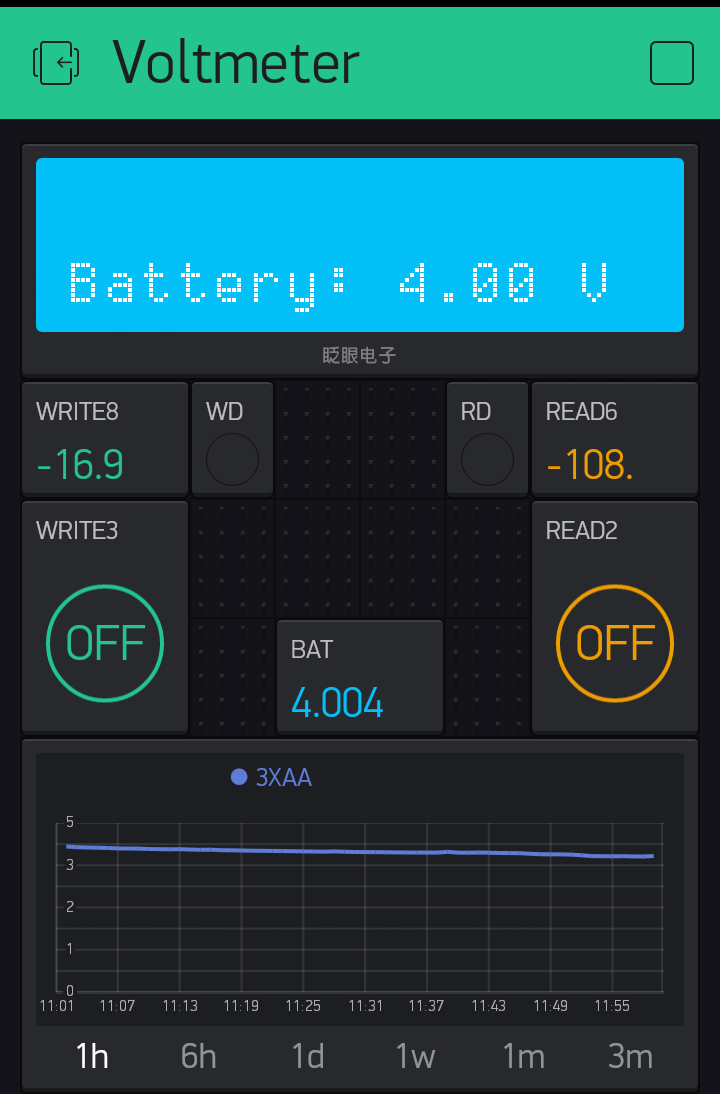
Over the last hour our ‘voltmeter’ has recorded a voltage drop from around 4.4V to 4.0V across a 3 X AA battery pack.
The screenshot below indicates a starting point of below 4.0V falling to around 3.5V i.e. the scale seems to be out. As I type this I see a similar finding was noted in November at Still an issue with history graph / graph scale on Android?
Looking at one of our temperature graphs where the reading is around 21.1 the graph is showing an ‘offset’ of some kind that clearly shows a temperature below 21 degrees. Difficult to assess the exact offset as temperature is slowly increasing but it doesn’t seem to be a fixed offset of 0.5 as it doesn’t appear to be showing around 20.6, more like 20.8.
@BlynkAndroidDev quite difficult to say based on the scales you provide but I would say the bug is still there with the latest build. Temperature is currently around 19.6 degrees and the graph is showing just over 19 degrees.