This project is monitoring power output of solar panels. The history graph logging the power output seems to be inaccurate on the time axis. I would expect peak power to occur at the same time each day. But the graph does not represent it this way. Is it a known problem?
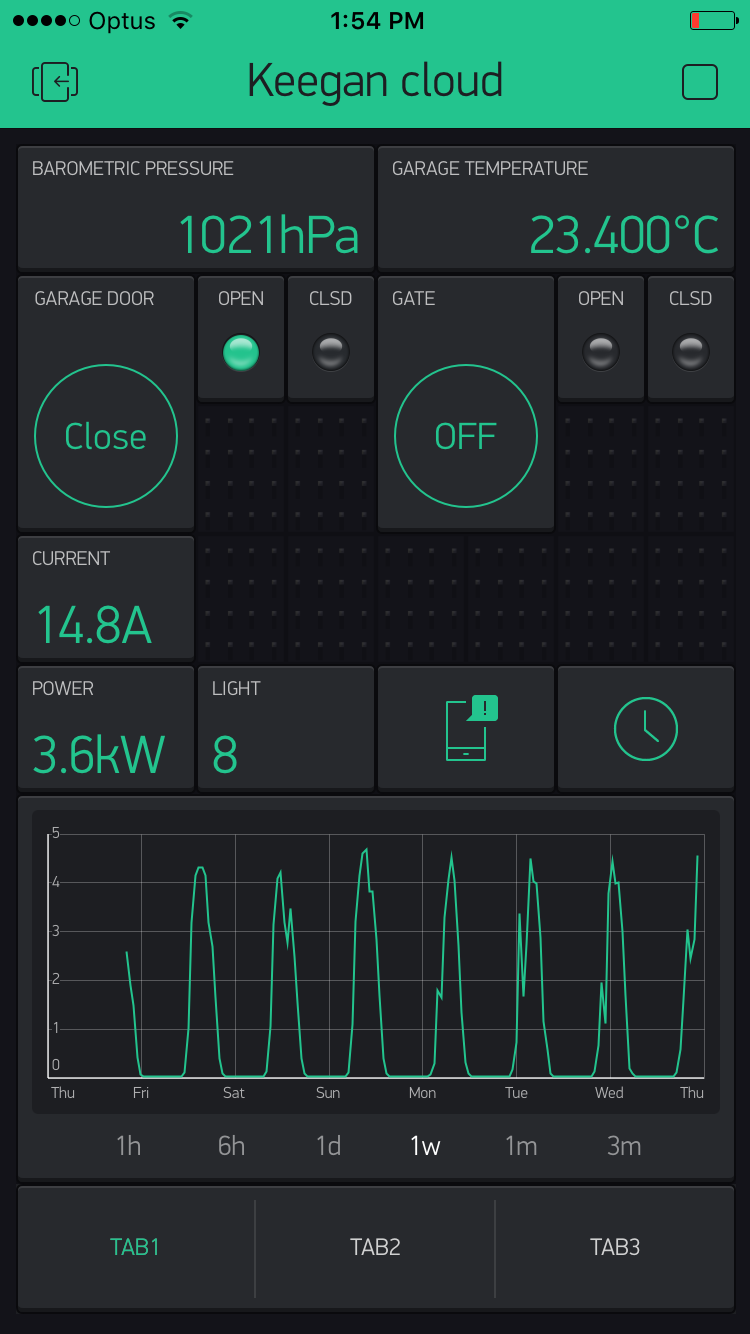
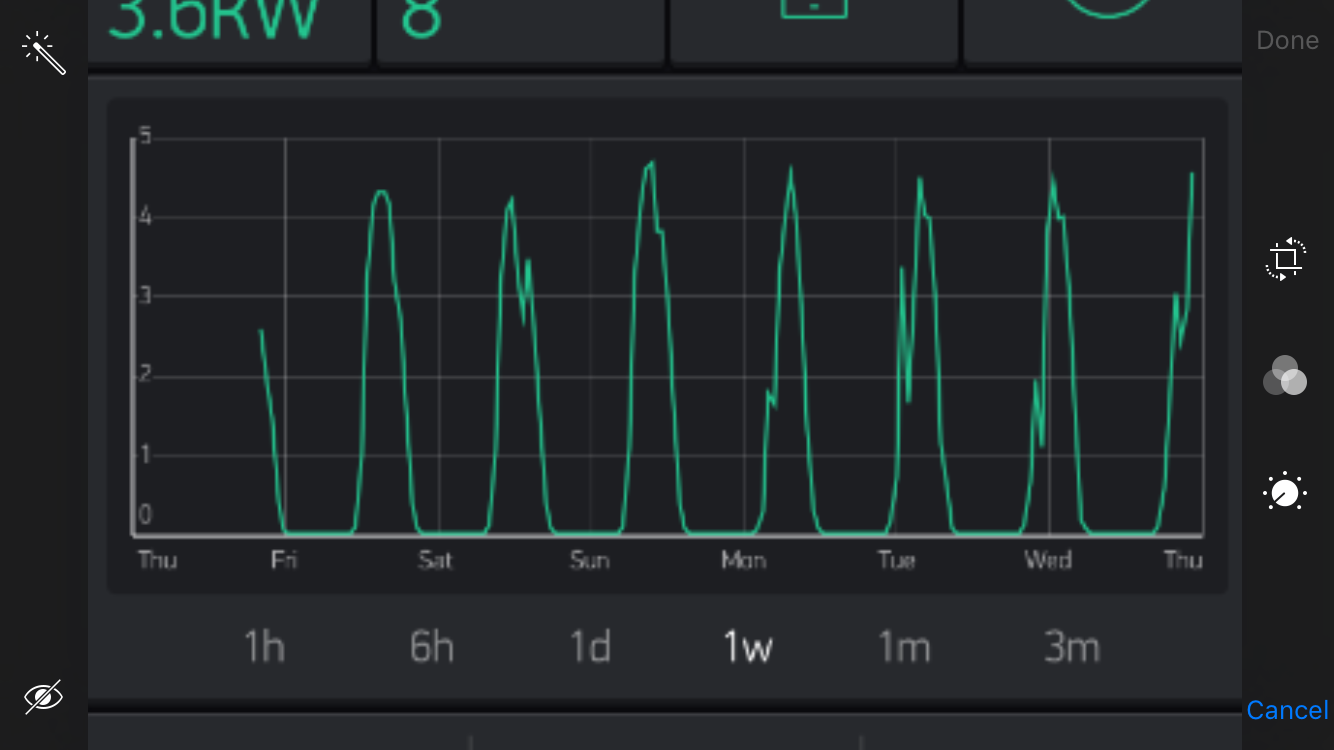
See how the peaks of the graph do not line up with midday every day. It seems like the scale is wrong.
It’s dark here now. Australian time 
Thought it might relate to different frequencies that the data is sampled at for the different time periods.
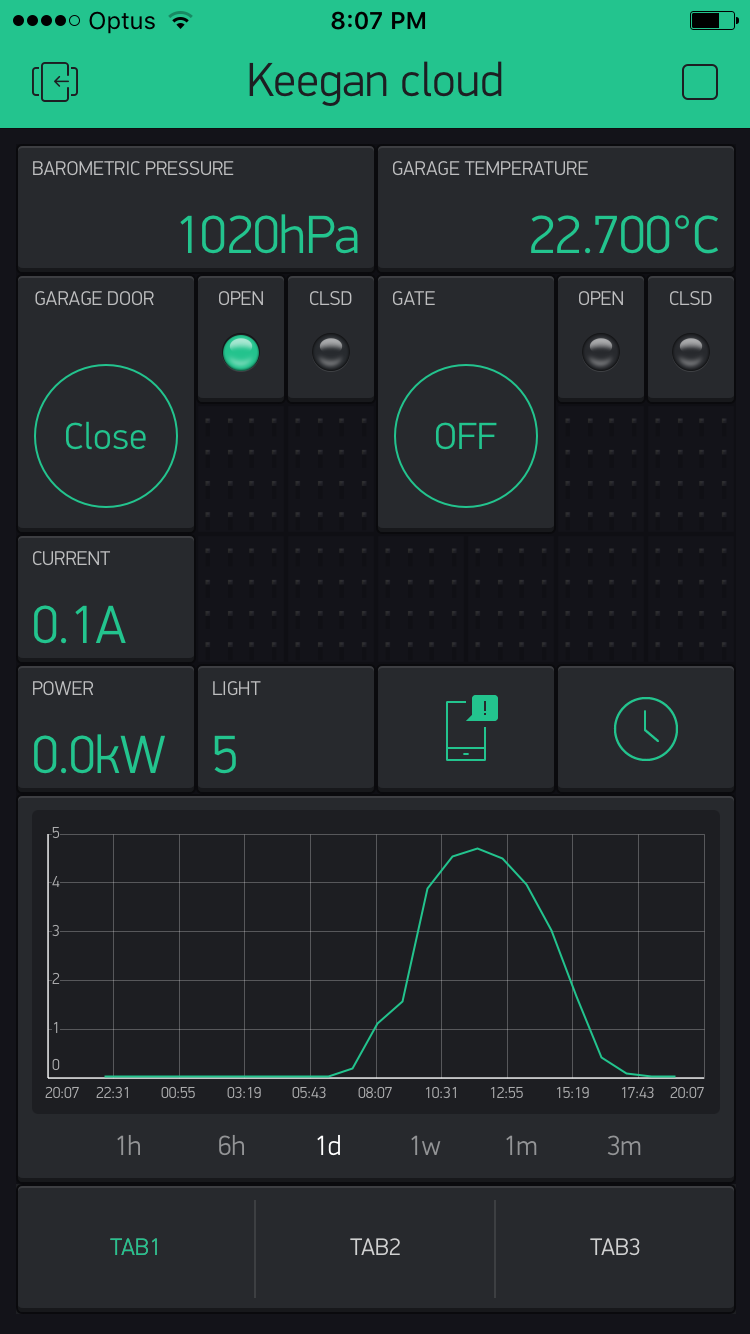
You would expect the 1W view to show the peaks at midday though and http://docs.blynk.cc/#widgets-displays-history-graph states the graph updates for 1w are the same as 1d i.e. hourly.
Thanks for showing an interest in it costas. Yep, I think it is a Blynk issue as the solar panels consistently make best power at a similar time each day and on the history graph it just doesn’t represent correctly.
@NickMurray might be worth you puling down the csv files to see if that gives any clue to the problem.
Ok, good suggestion. I have never done that before but I’ll research it and try.
Is it done from the server admin panel?
It’s done from the app, swipe the graph and you should have 2 options. Delete the data or send csv data to you via email.
Yeap, seems like a bug. The CSV data should be fine, however labels positioning could be wrong. Is that iOS or Android? What device?
iOS iphone6
Thanks for looking into it
1 Like
I have exported the csv file via the app. Looks like the csv file has been compressed as it has a file extension .csv.gz
What program can I use to open this file?
EDIT. Got it. I used a program I found called 7-zip then excel
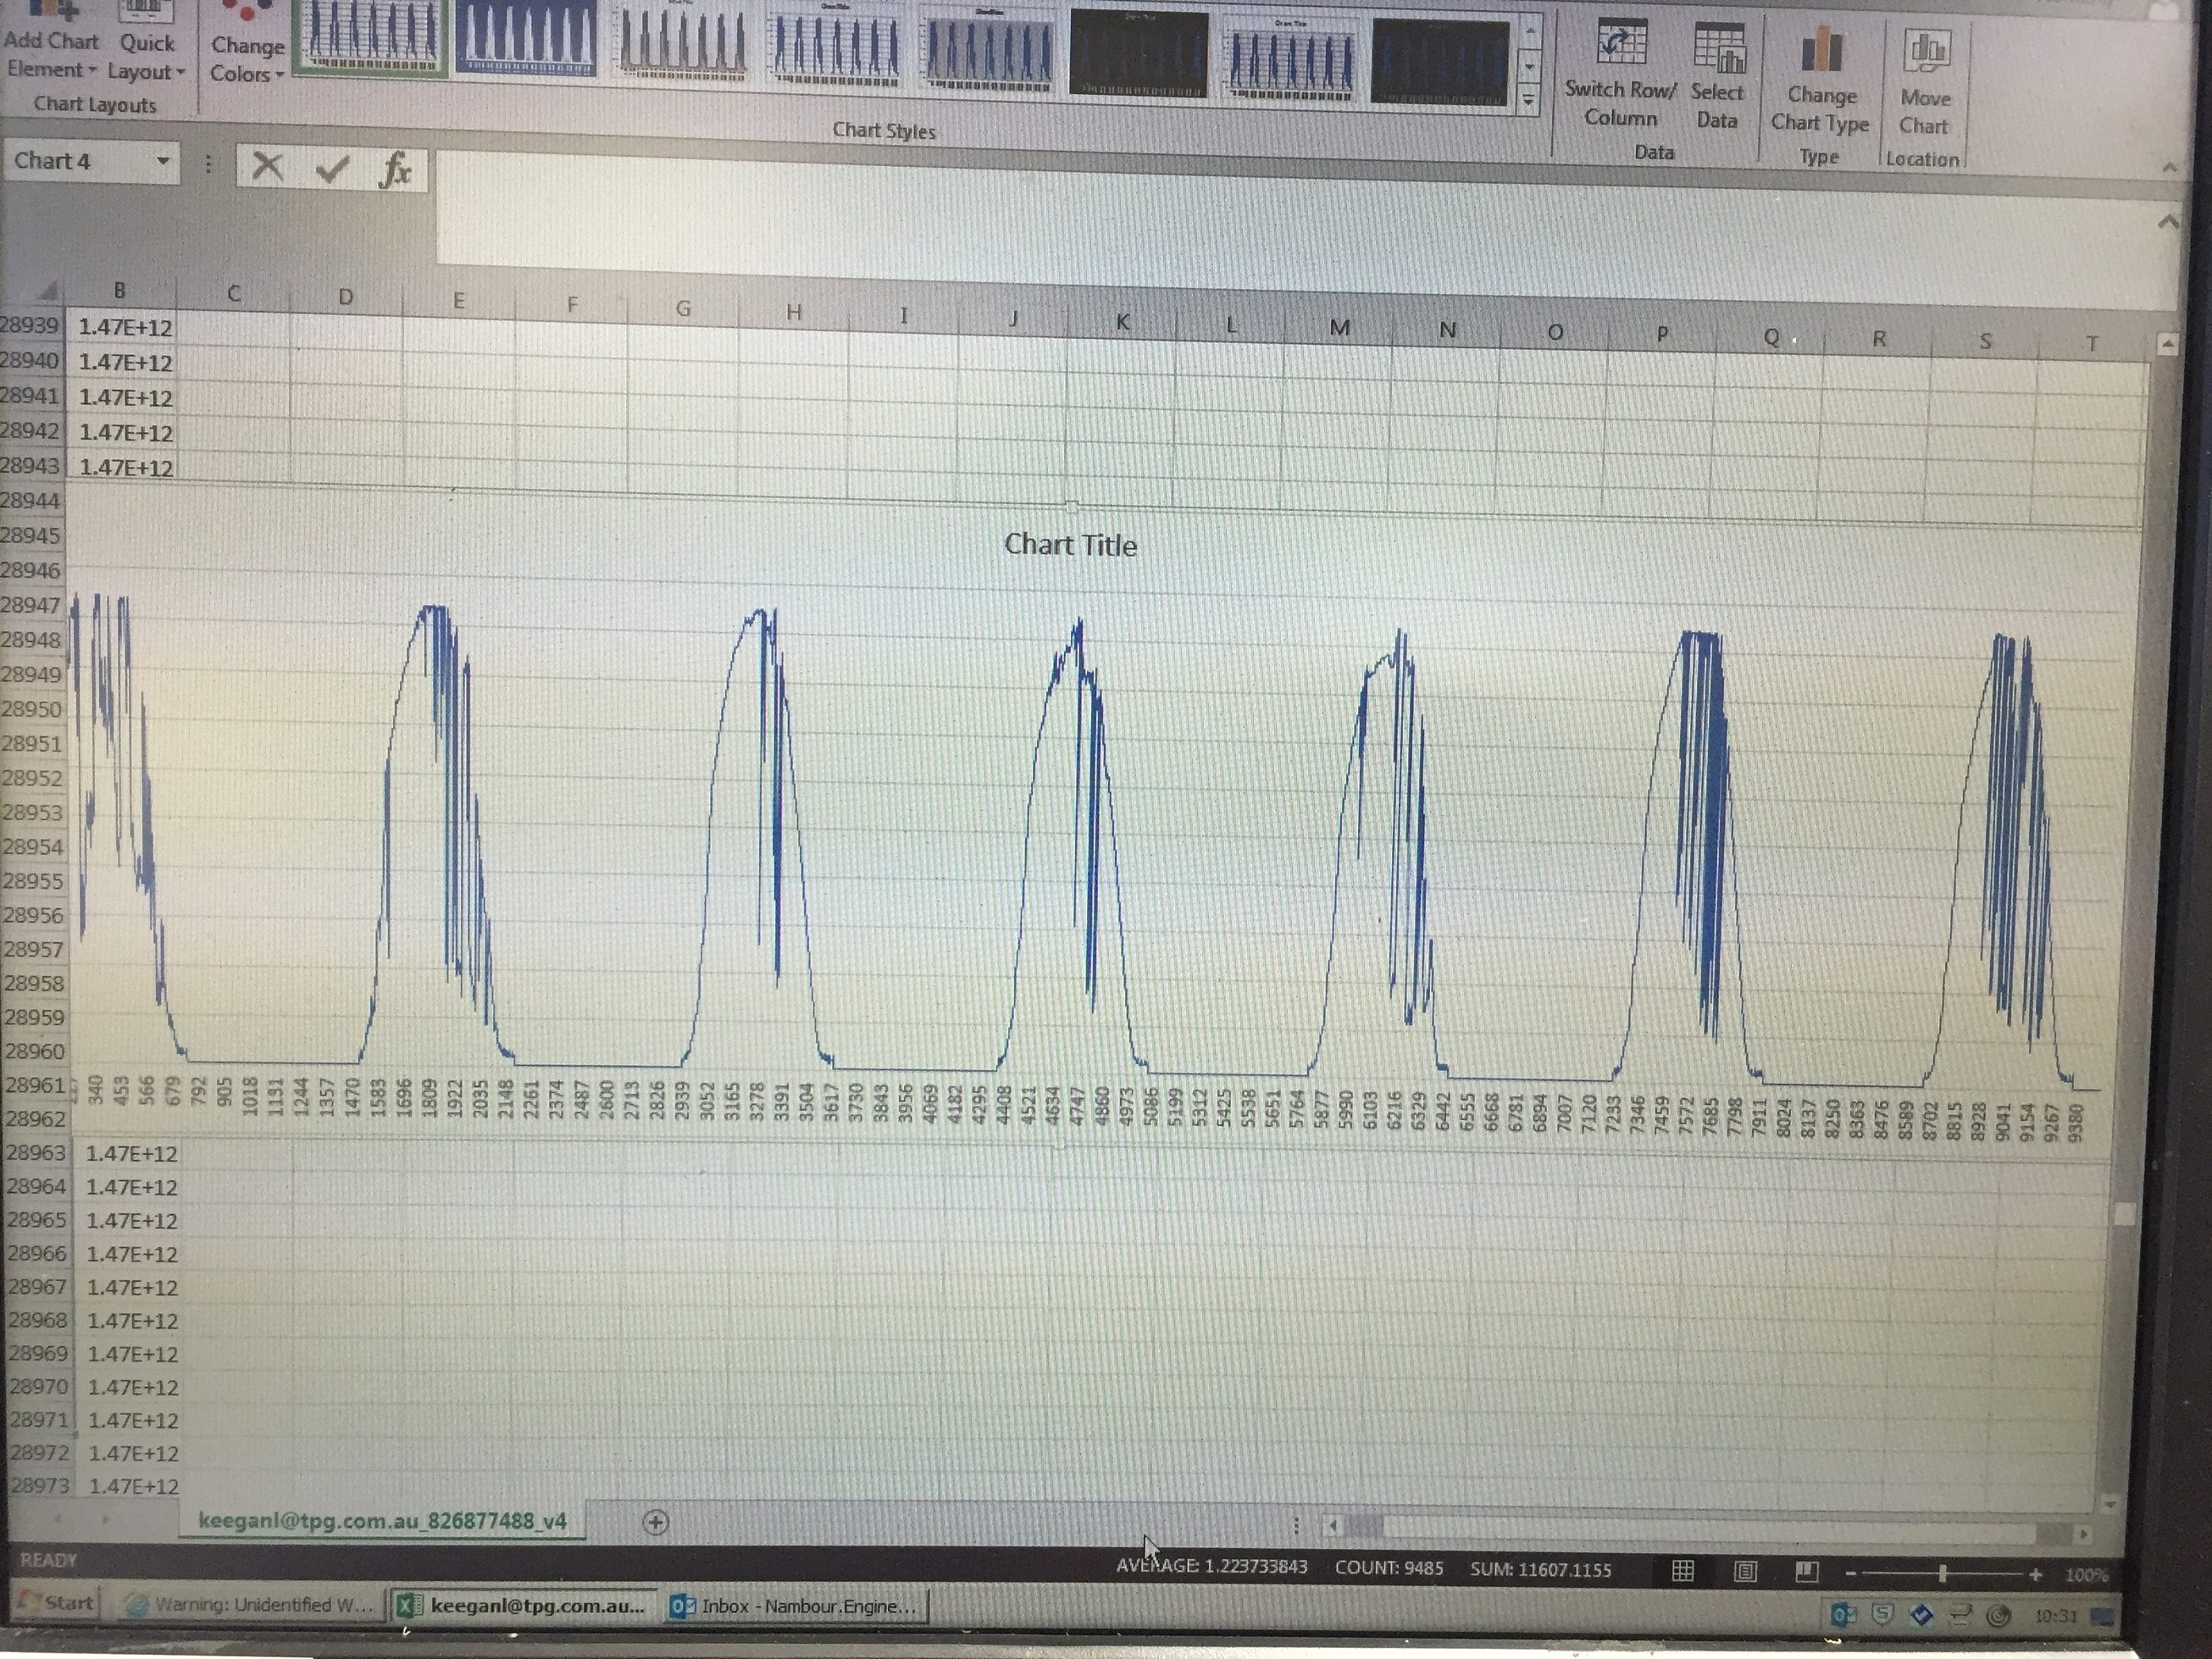
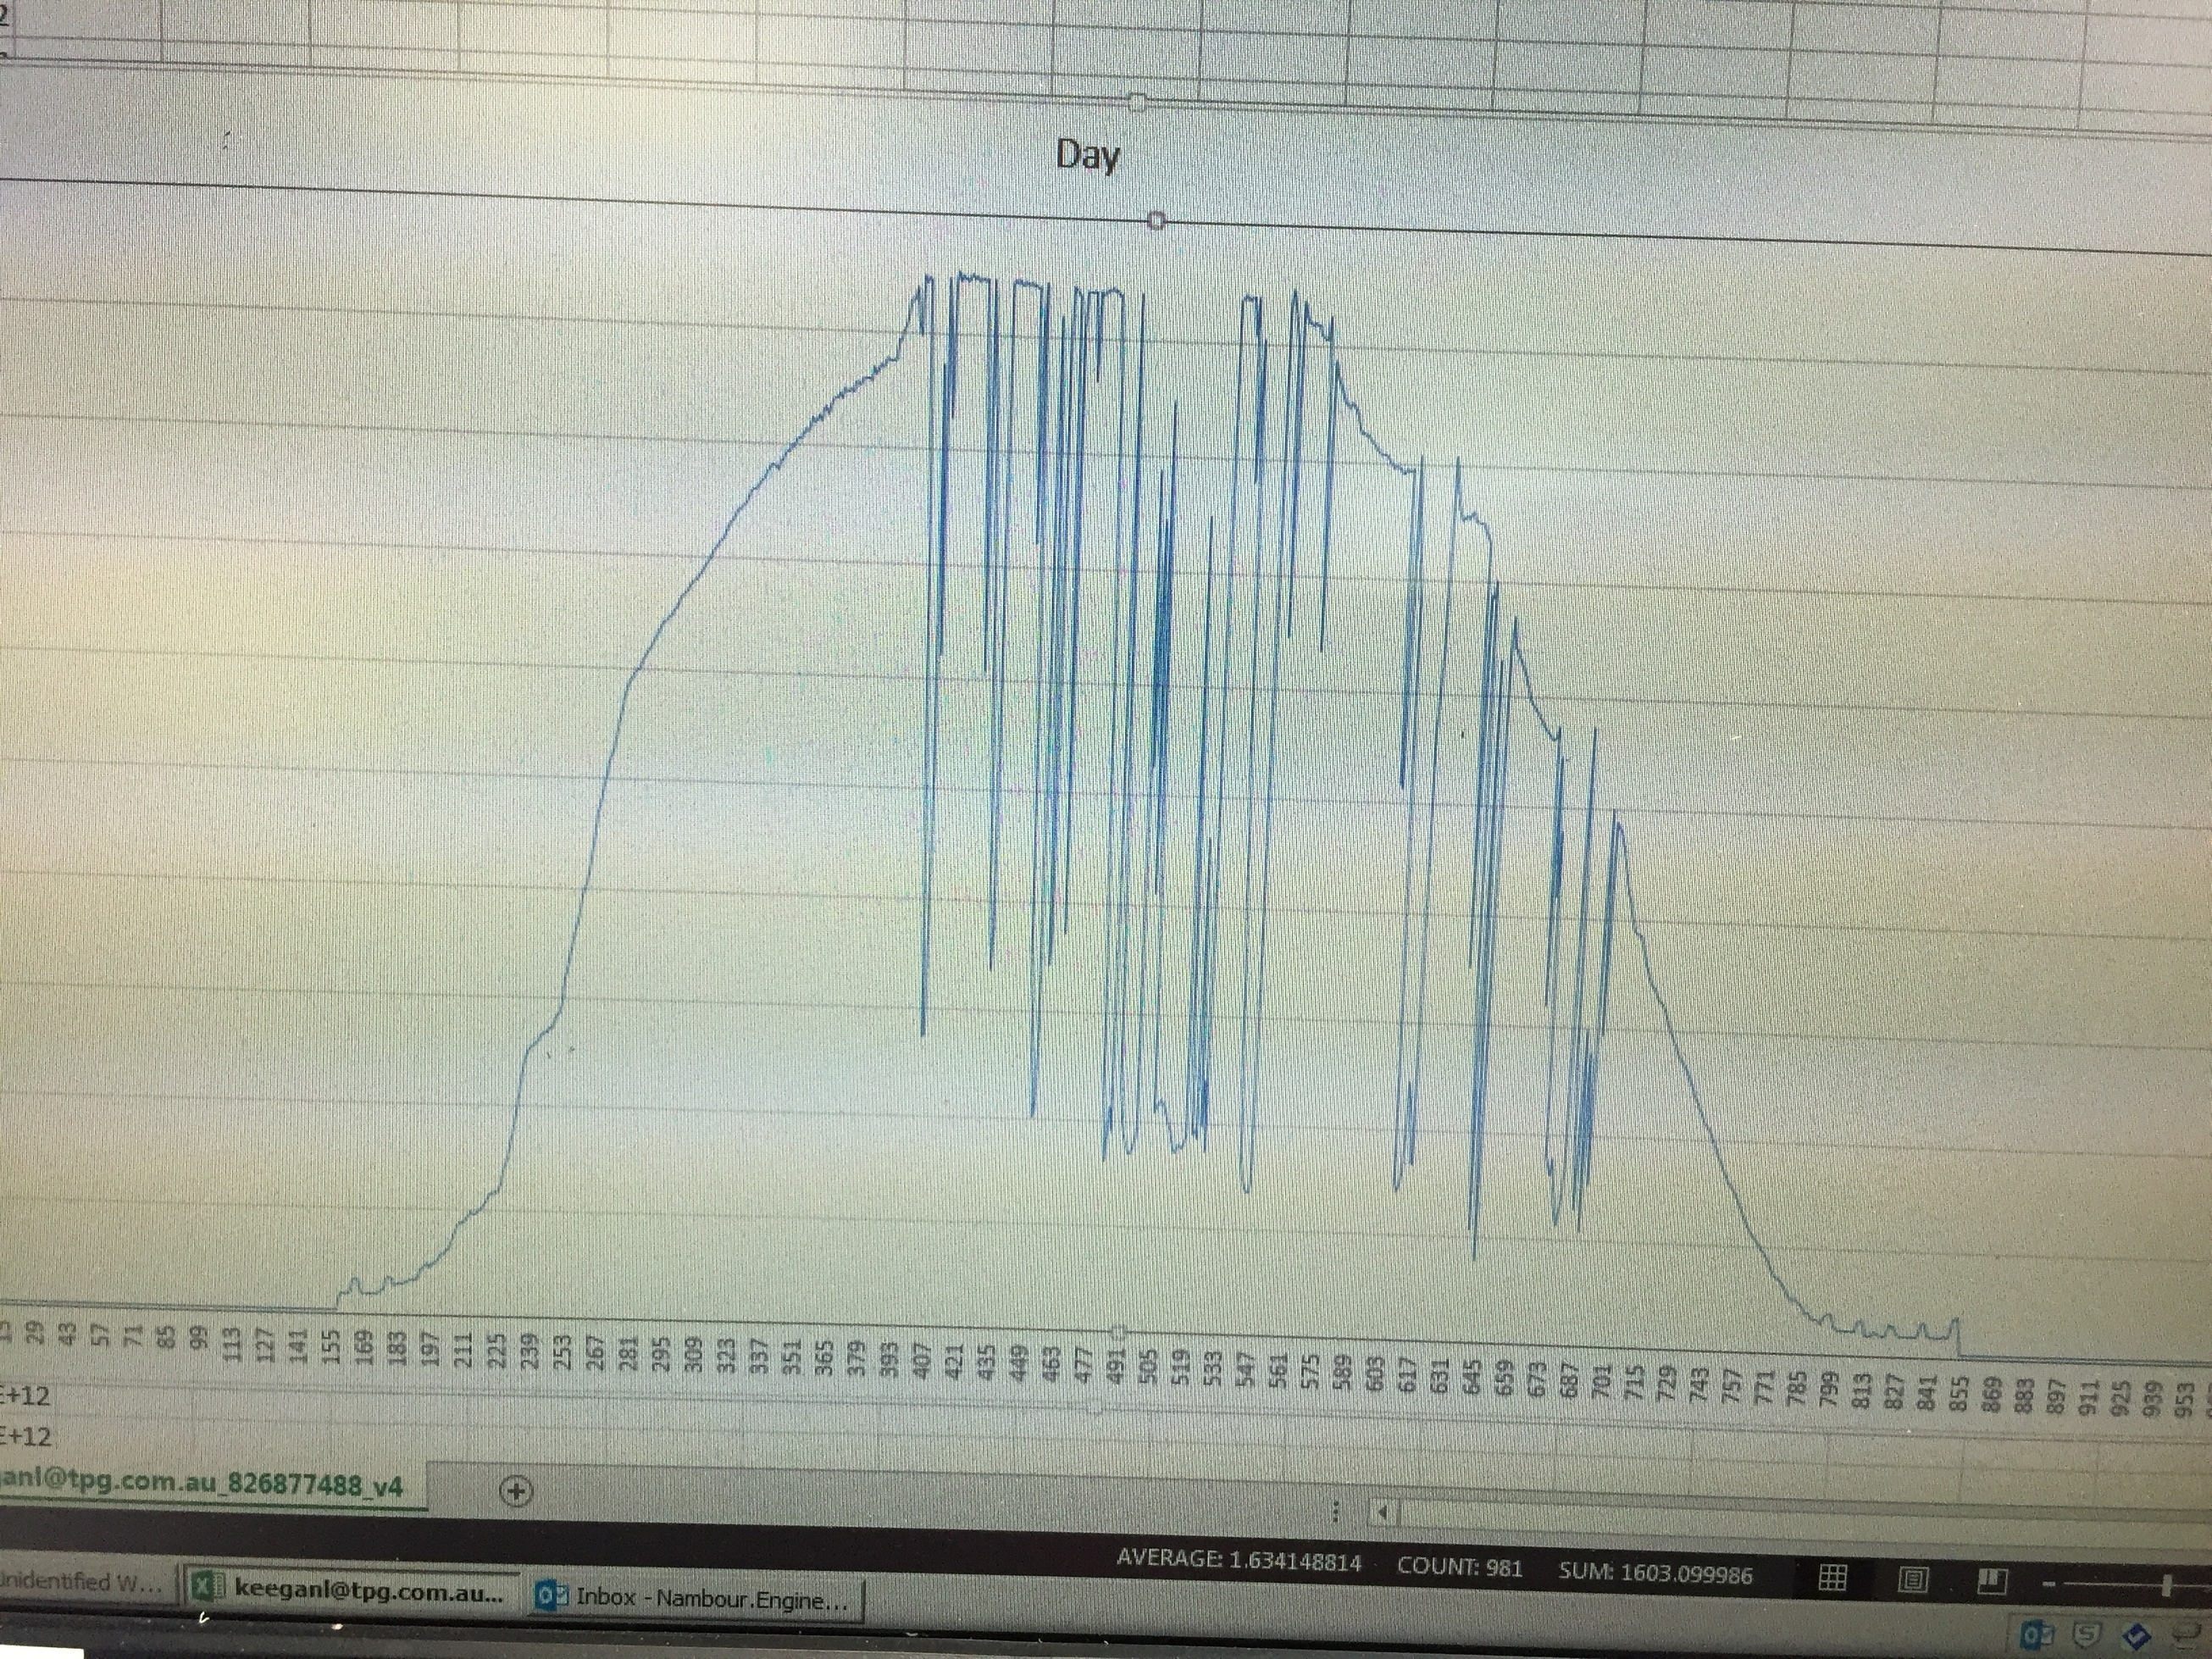
PLEASE NOTE; The days I have selected to graph in excel may not be the same days that are shown in my original post which pictures a seven day Blynk history graph
I see exactly the same behavior for my temperature graph in the “week view”. The peaks move more and more to the left compared to the vertical lines which indicate the days.
1 Like
@NickMurray Could you please share your project with me for a while? (I mean using sharing QR from project settings). Ill appreciate if you sent QR to my email (shartax@gmail.com)
Hi,
Email sent with sharing QR code. Sharing is on and project running.
@NickMurray Thanks!
The issue is fixed and the solution will be available in the nearest app update.
2 Likes
Wow, that was fast. Thanks