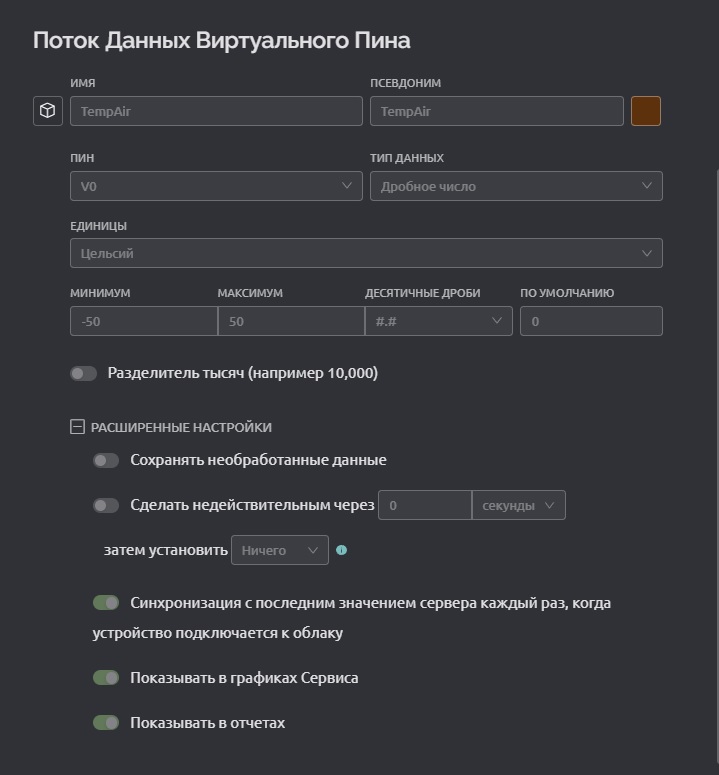
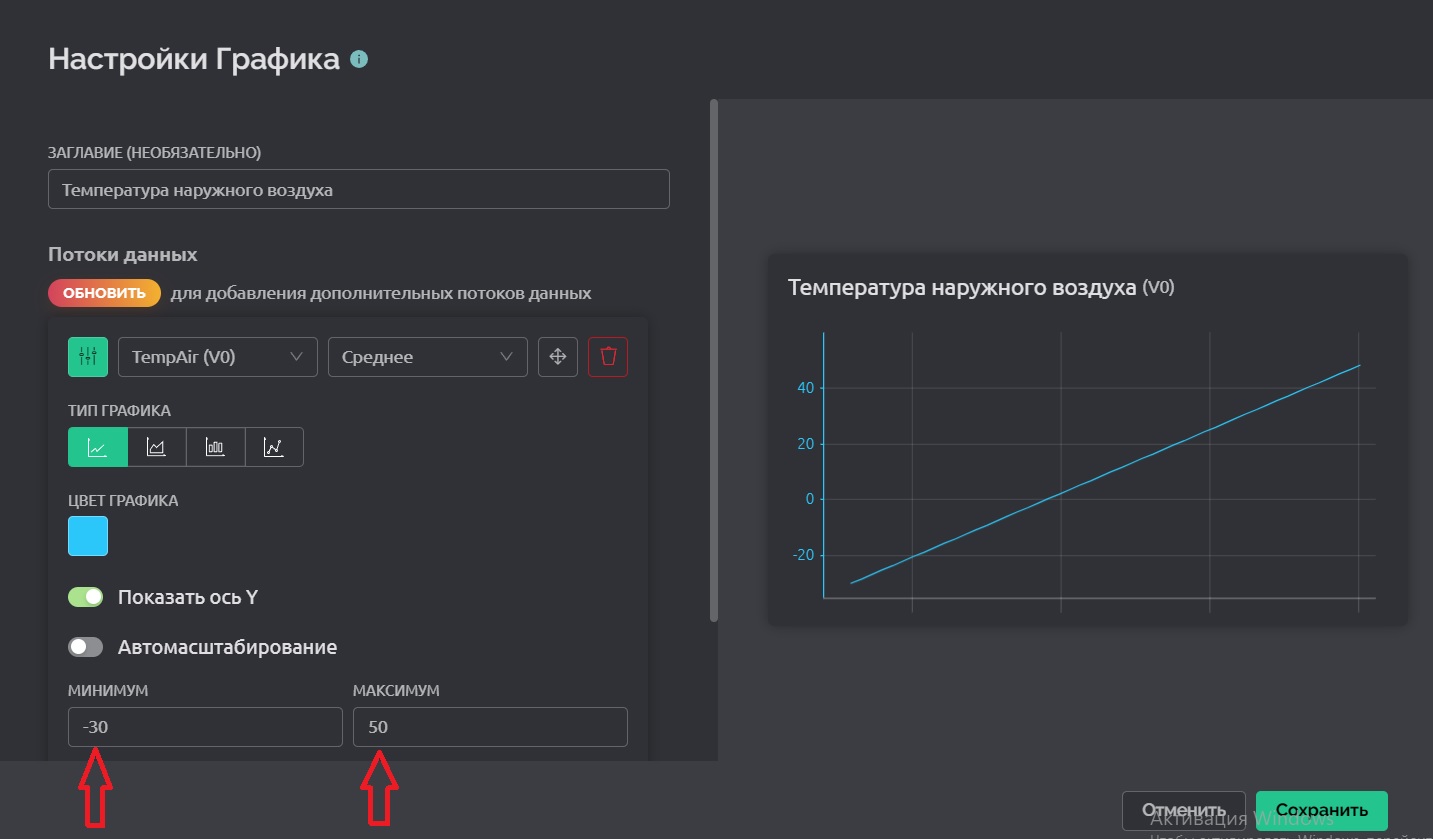
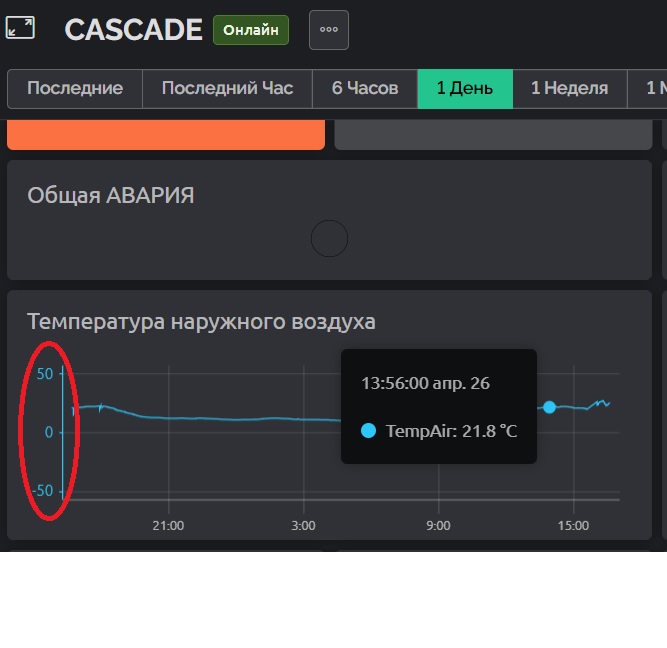
Setting the scale of values on the Y-axis of the graph: -30 - 50; actual value on the chart: -50 - 50, - corresponds to the settings for this pin.
Thank you for submitting the issue.
There were some several around Chart widgets made, so we started a discussion on that.
1 Like