Hi,
thanks to the creators of the blynk. great stuff, love it very much!!! allows even me as a greenhorn to get information to my phone!
But currently I dont know how (or possible):
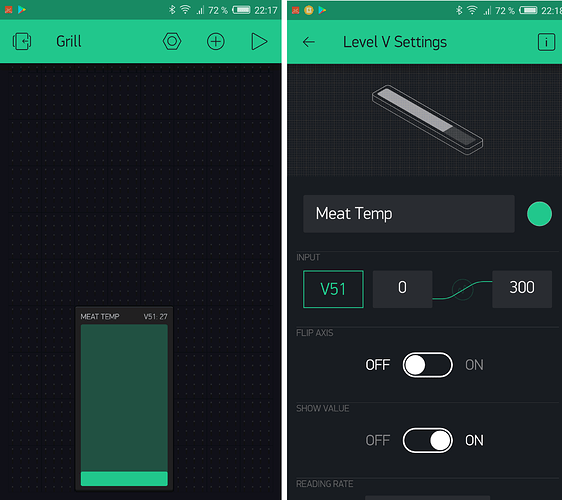
I would like to have a graph or something visual like:
it shows the value of 27 which is the current temperature of my probe.
within that bar chart I have to set the max value (300) to a fixed value
I would, however, like to set that value to some thing changeable.
To give en example,
the 27°C is the current temperature of a piece of meat on the grill.
in my sketch, I set the end temperature to 54°C.
The graph should therefore show 27/54 = 50%
can this be achieved?
thanks
