I try to measure consumption of water, gas and elektricity.
I use ESP8266 and fotodiode. For now u have interface from eletricity meter.
Im count pulses for 60 s and then sent number with virtualwrite to V61.
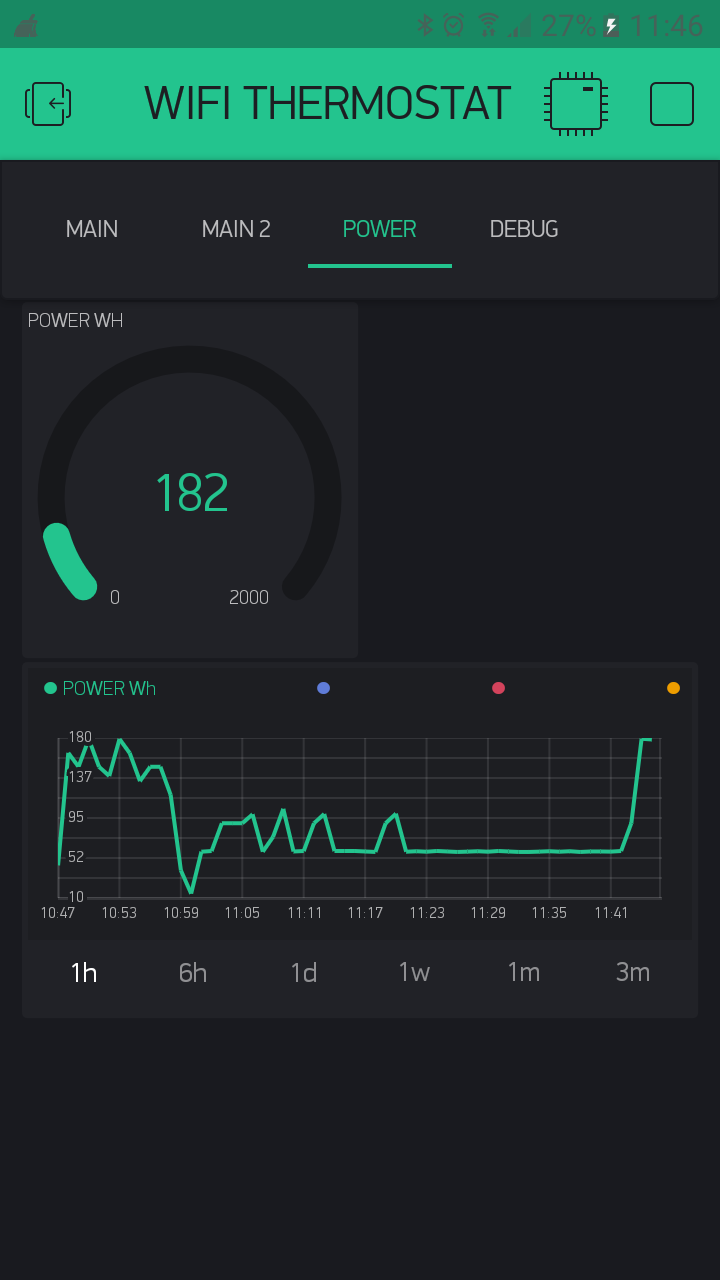
i show data in gauge and history graph.
Problem i have when i try analayze data from history graph.
When i chose 1 h data are correct.
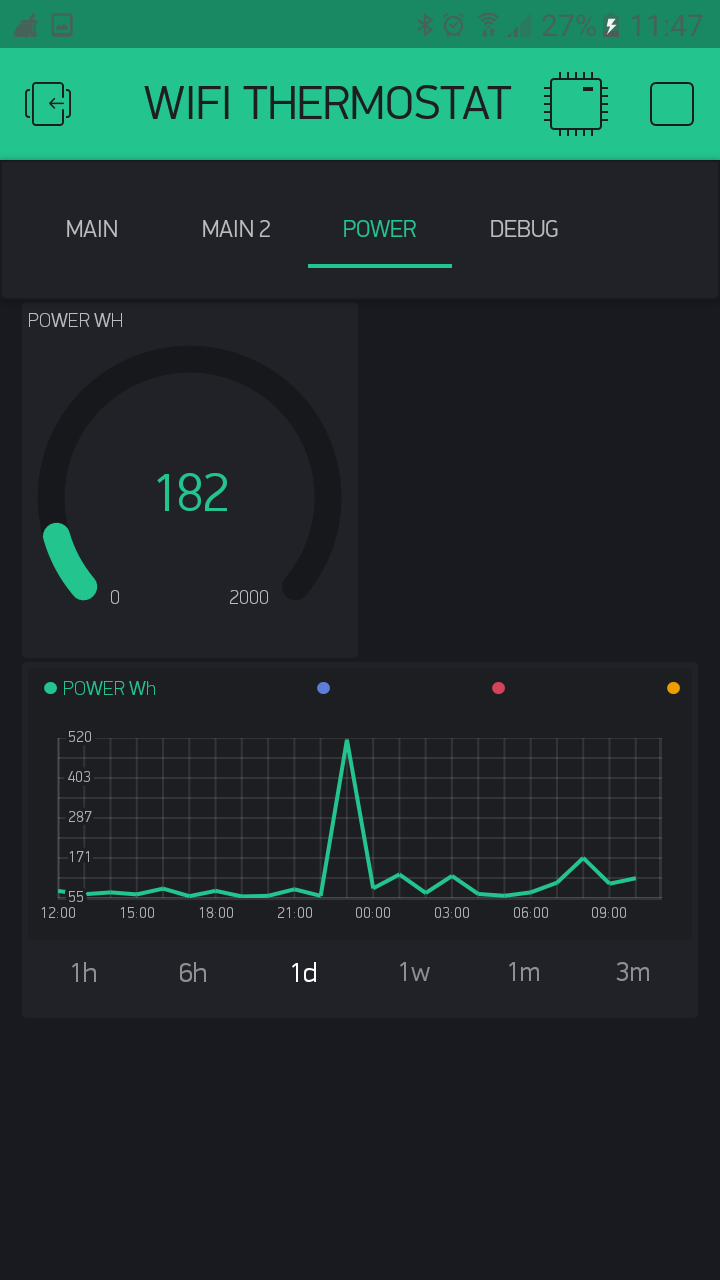
when i chose all other data are incorret. Why?
Calculation for all other data is average. if you show temperature is OK.
but i like to show consumption. I need SUM calculation.
And what is the incorrect data? It looks pretty OK to me. Maybe your calculations are of or not normalised enough. E.g. too many reading faults which would cause weird spikes. If you read from the analogue port I can imagine this could be the case.
Can you show us (schematic) of the hardware connections?
History graph calculate average result,
but i need sum result.
simulation of data:
for x day
from 00:00 to 00:59 PWR = 200 Wh
1:00 to 01:59 PWR = 321 Wh
etc
…
22:00 to 22:59 PWR = 300 Wh
23:00 to 23:59 PWR =700 Wh
for x day is SUM PWR = 12431 Wh or 12.431 kWh
Im change program.
now im calculate PWR per HOUR and DAY.
Result is better
BRGreg