I’m getting there. Got my initial ESP8266 BlynkEdgent working, then my ESP32 version working and also OTA. Yippee. My practice sketch is reading temp and hum with a DHT22. I have a timer checking if the temp has changed ± 1 degree and if so does a Blynk.virtualWrite for the temp and humidity. I also have a button which will do the same regardless if the 1 degree threshold has been met. I’ve played with success using labeled text and gauge widgets. I’m now trying Supercharts with the mobile app and charts with the web app. I’m on the free plan which is supposed to allow a week of history and the documentation appears to say to activate that with “advanced settings” on a datastream and enable but I don’t see the advanced settings selection for any of my datastreams. Where is it hiding?
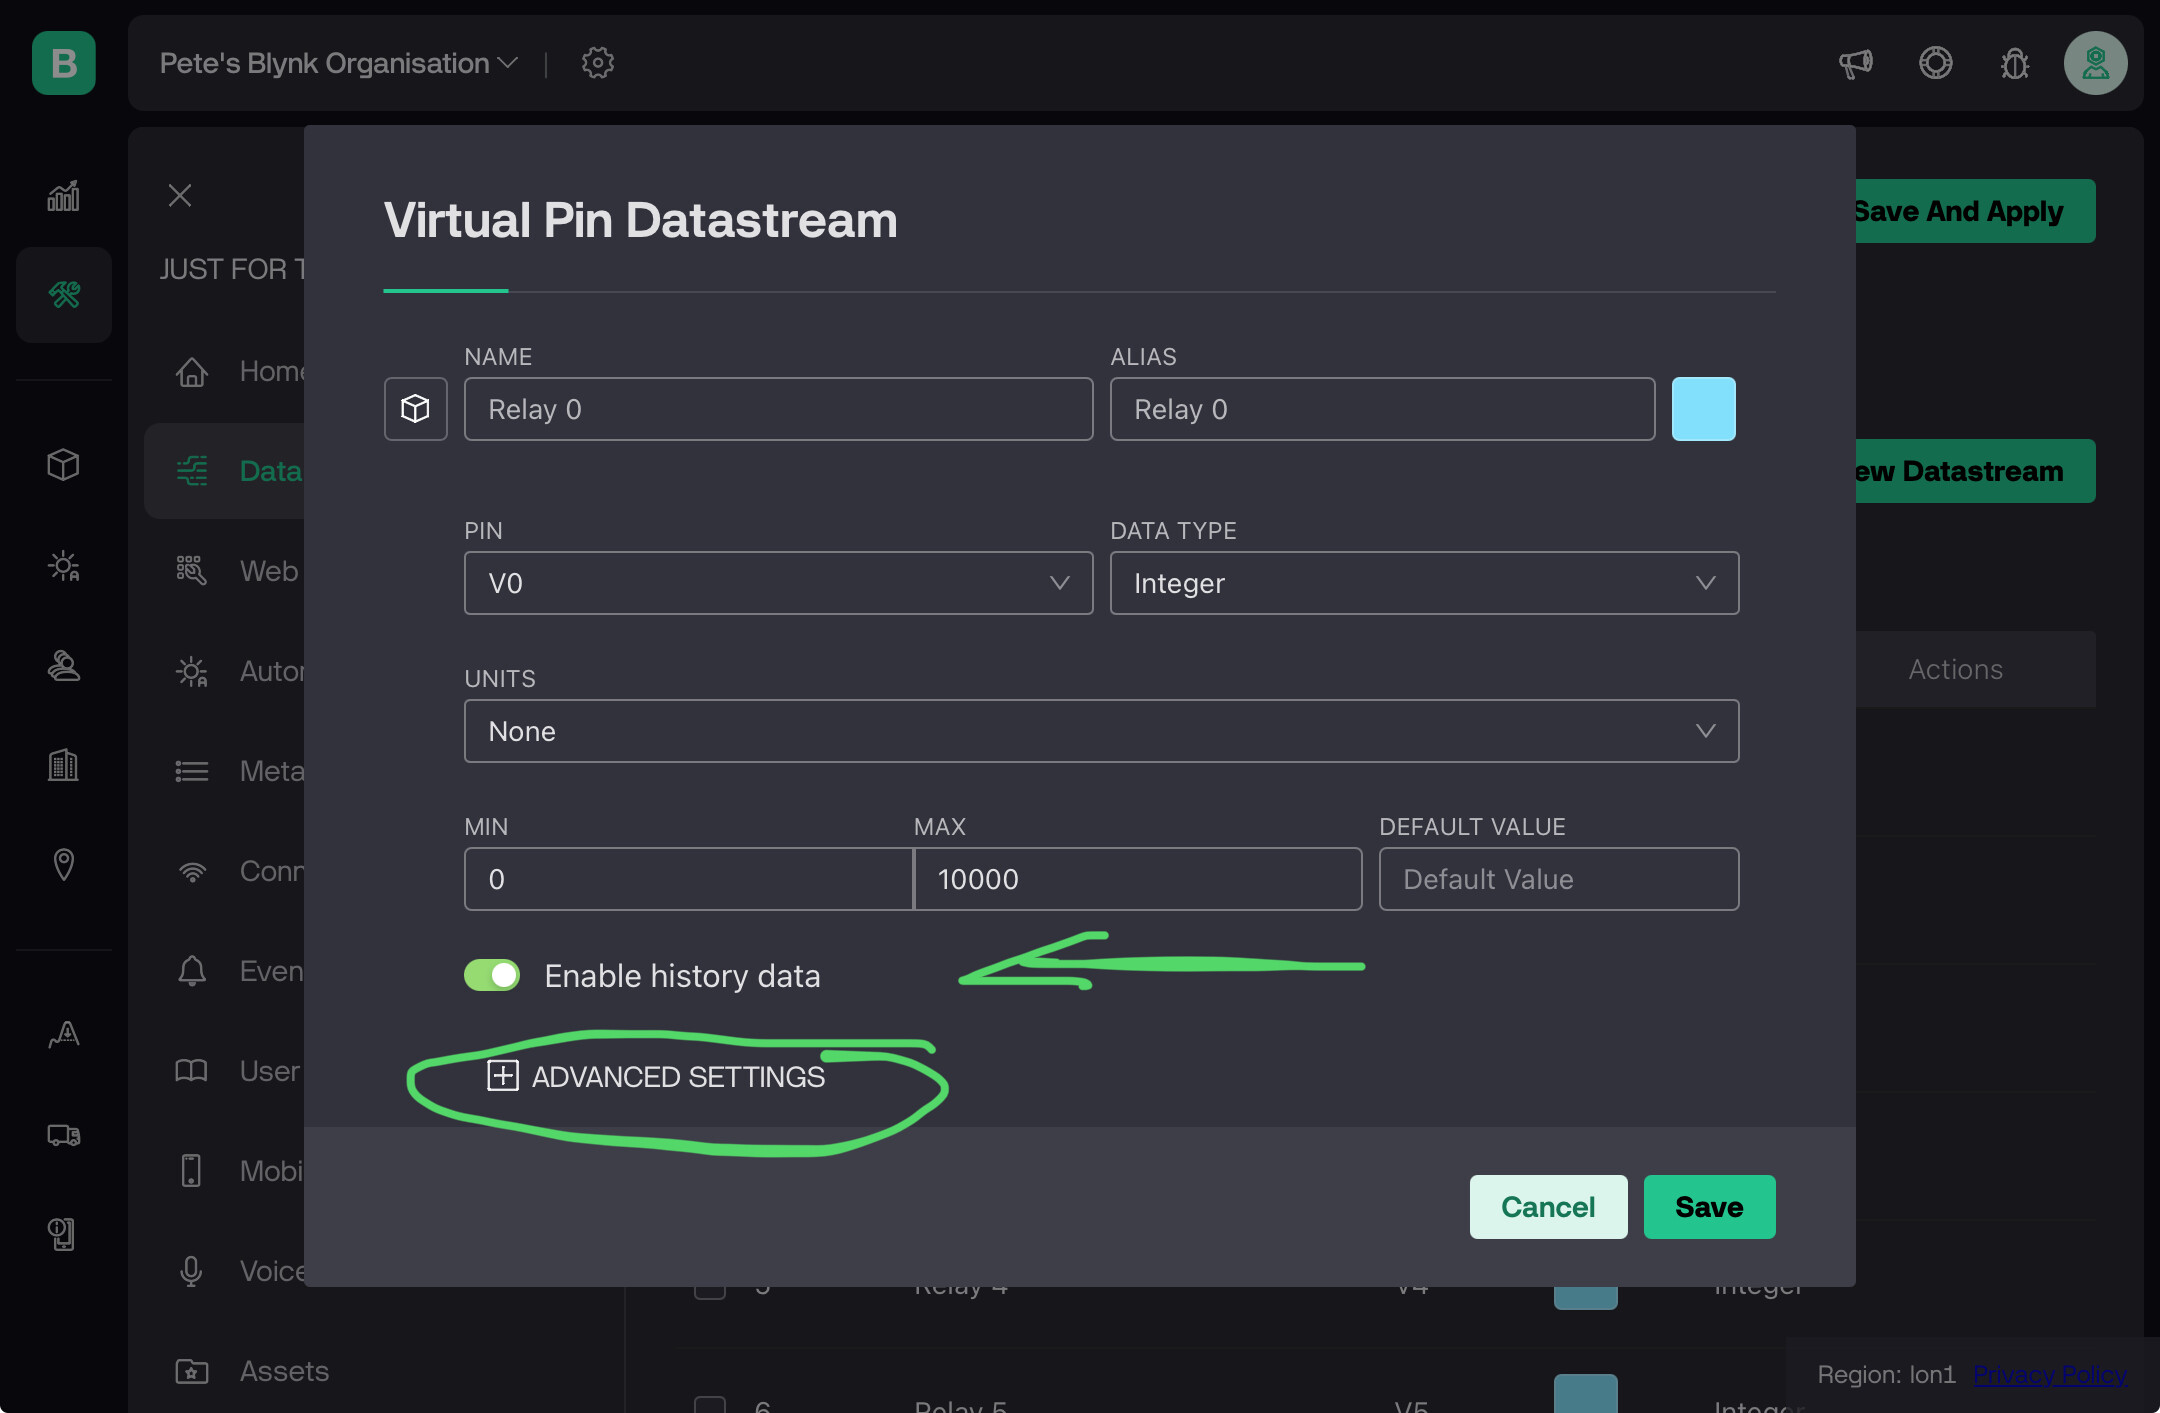
The advanced settings section is circled, but it’s actually “Enable History Data” that you need to turn on.
Pete.
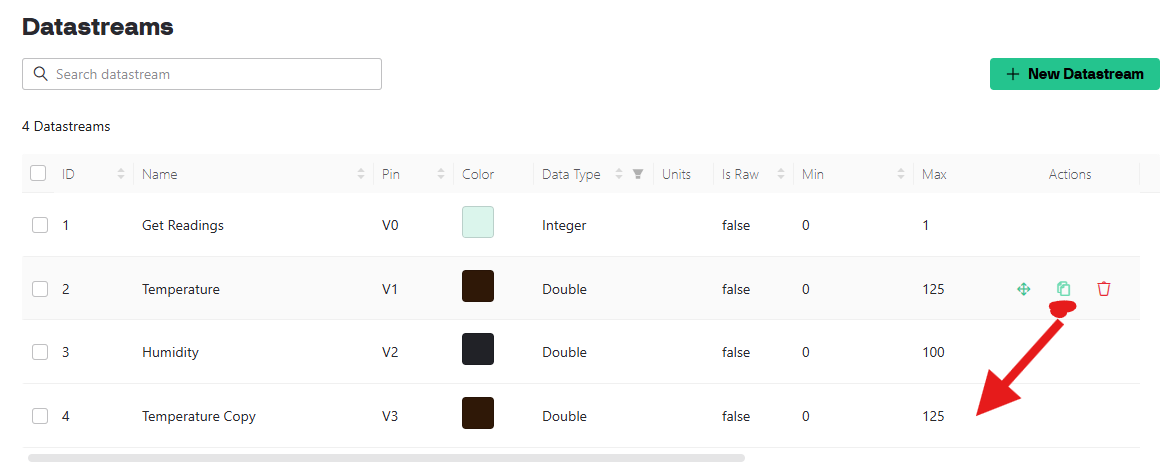
Thanks. The only way I seem to get that is by clicking on the “copy” icon and then it duplicates the datastream. Is there a way to edit an existing datastream?
Also my page just says “Datastreams” not Virtual Pin Datastream so I must be looking in the wrong place. I don’t see any place to click to edit a particular datastream.
Do you have Developer Mode turned on?
Pete.
Simply press the datastream name to open its settings.
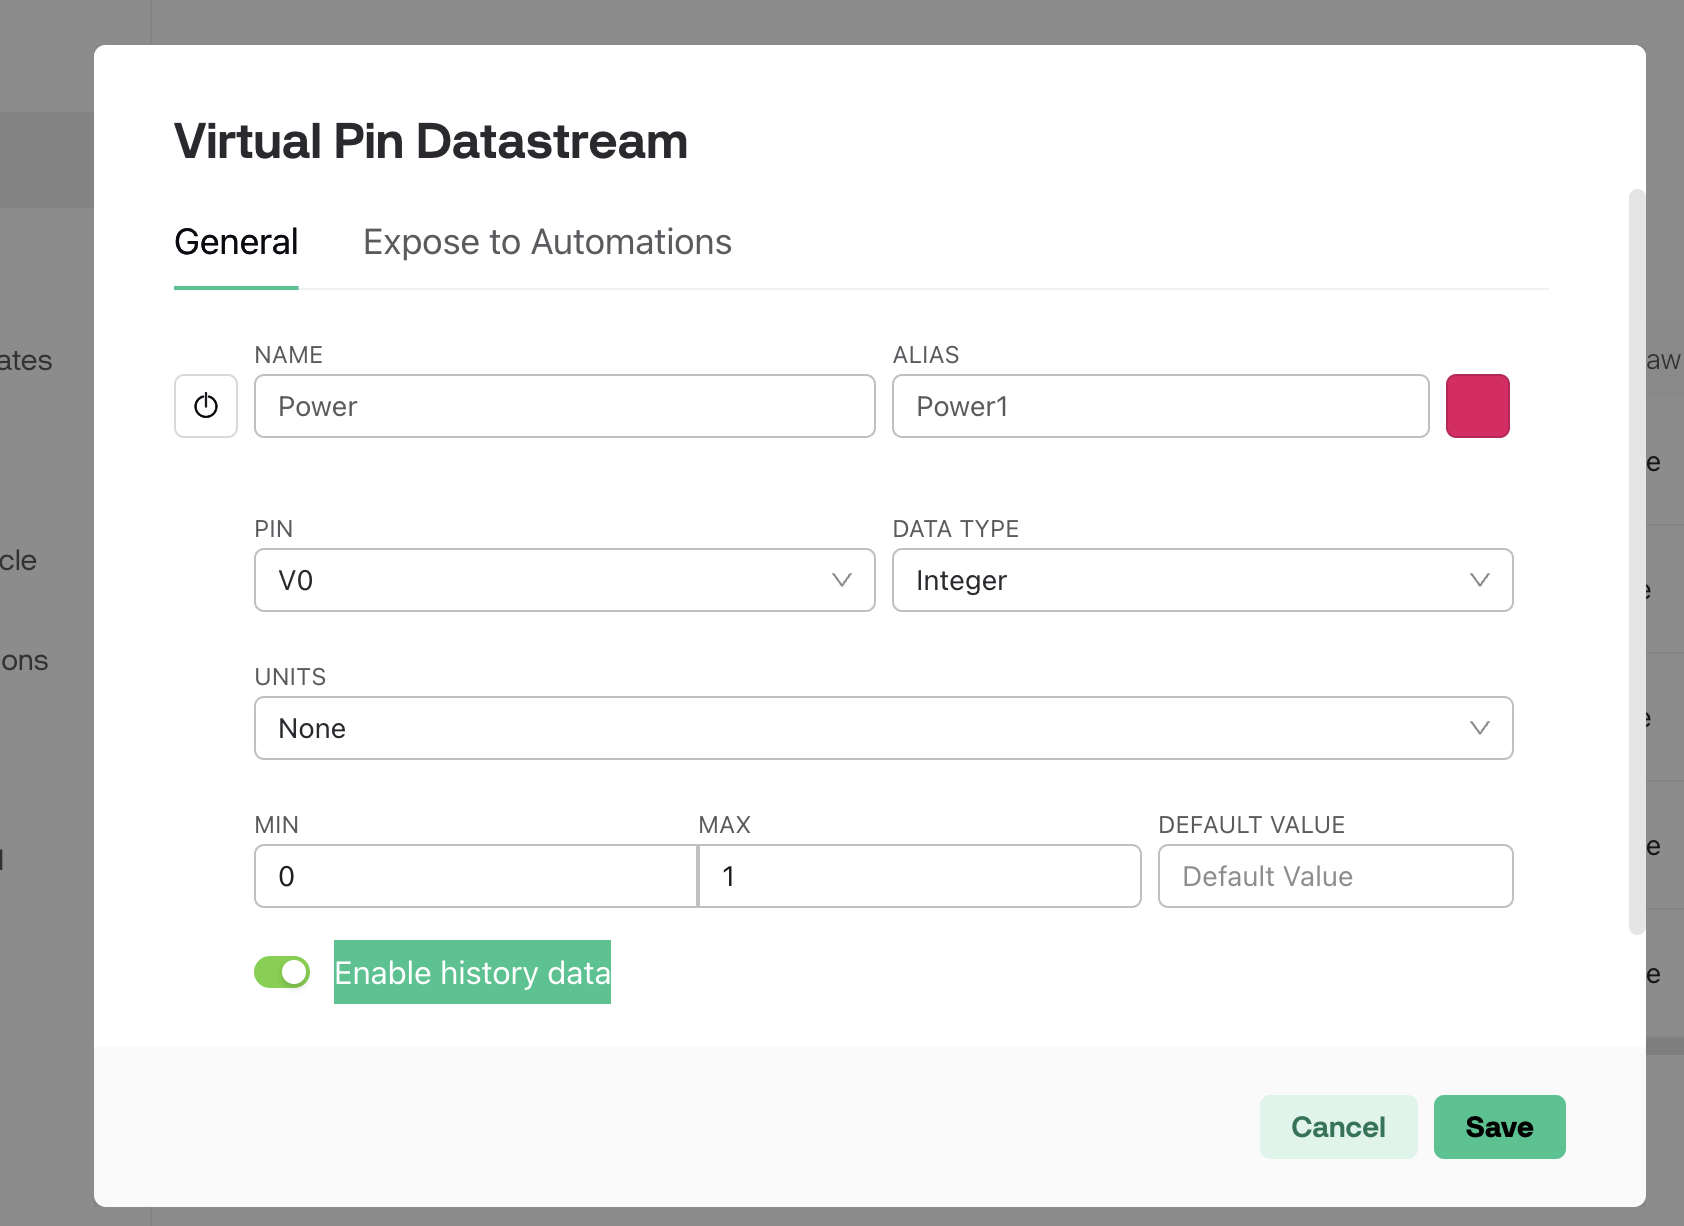
Then, turn the “Enable history data” switch ON to enable the historical data.
After that, press Save in the top-right corner of the page.
Thanks (for your patience). So when I hovered over the datastream name no finger pointing hand showed up just the mouse pointer and it said “click to copy name” since that is not what I wanted to do I never clicked. But with your guidance I clicked it and there it was. If it would have said ‘click to edit’ and done the normal thing with the finger point it would have been clear. Thanks again, Pete.